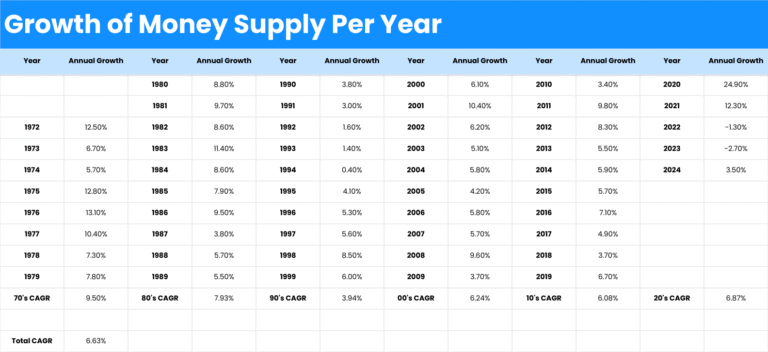
Analyzing the U.S. Money Supply (1972 – Today)
What is the Money Supply? The money supply is the total amount of money that is circulating in economy. It’s also known as the M2 money supply. Key Components of M2 Money Supply – Cash– Checking Accounts– Saving Accounts– Money Market Funds It’s essentially any money that can be converted to cash quickly and be…