Physical Address
304 North Cardinal St.
Dorchester Center, MA 02124
Physical Address
304 North Cardinal St.
Dorchester Center, MA 02124
If you’ve never heard of the M2 money supply you’re not alone. It’s not something that you learn about in school or hear on the news.
Mainstream news focuses on the stock market, inflation, and unemployment. However, M2 is lurking in the background, and has been growing steadily at 6.6% per year since 1972.
Once you understand the M2 money supply, you will look at your paycheck, raises, and investments with a completely different point of view.
This article is going to explain what M2 is, why it grows, what it does to average working people, and what (if anything) you can do about it.
The M2 money supply is the total amount of money circulating in the US economy (cash, checking accounts, savings accounts, and money market funds).
Since 1972, the M2 money supply has grown at a CAGR (compounded annualized growth rate) of 6.63% per year.
That growth dilutes the value of every dollar you already hold, even if prices haven’t visibly gone up yet.
A 3% annual raise sounds good until you realize the money supply is expanding at more than twice that rate.
M2 growth affects more than your paycheck. It pushes up asset prices (stocks, real estate, gold) and widens the gap between people who own assets and people who don’t.
CPI (the government’s main inflation measure) does not capture the full picture of what M2 growth does to your purchasing power.
Understanding M2 is one of the most important steps any working person can take toward building real wealth.
The M2 money supply is the total amount of money circulating in the US economy at any given time. When economists or the Federal Reserve talk about “the money supply,” M2 is almost always what they mean.
It includes four main things:
These things can be converted to spendable cash very quickly. You can use dollar bills or your debit card at the grocery store instantly. Any money you have in a money market account can be withdrawn quickly and be used to spend as well.
M2 doesn’t include things like long-term investments or illiquid (hard to sell) assets. It’s the money that’s actively being used.
Think of M2 like the total size of a pie. Every dollar you hold is one slice. When more slices get added to the pie (more money gets created), your slice doesn’t disappear. But it becomes a smaller share of the whole thing.
That’s the core problem with M2 growth. Your dollars still exist. They just buy a little less every year because there are more of them competing for the same goods, services, and assets.
In 1971, the United States left the gold standard. Before that, every dollar was tied to a fixed amount of gold, which put a natural limit on how much money could be created. After 1971, that limit was gone.
The result? The M2 money supply has grown almost every single year since then.
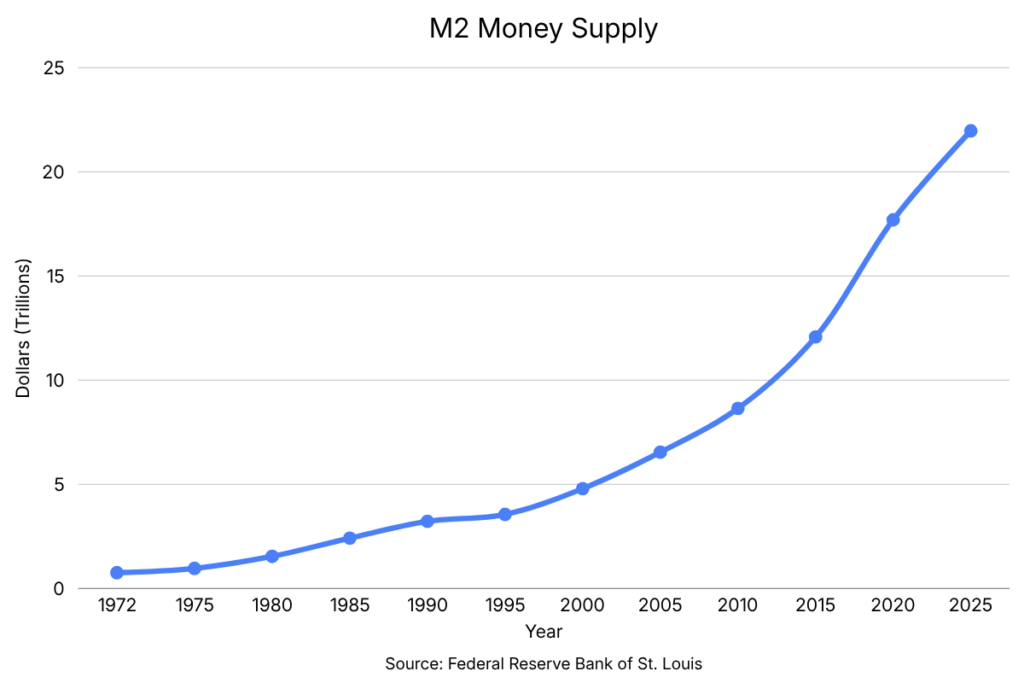
The most important number to understand is the CAGR (compounded annualized growth rate) of M2 from 1972 to 2024.
That number is 6.63% per year.
That means the total amount of money in the US economy has grown at a steady rate of 6.63% every year for over 50 years. Every time more money is created, the money you currently own becomes worth less.
This is sometimes called currency debasement or monetary inflation. It’s different from the price inflation you see at the grocery store.
Here’s the truth: M2 growth isn’t a mistake or a policy failure. It’s how the system is designed to work.
We live in a capitalist economy that needs constant growth to function. Companies need to grow their revenues. Governments need to fund their spending. Banks need to issue loans. All of that requires more money to exist in the system.
The Federal Reserve (the US central bank) controls monetary policy. It doesn’t print money directly, but it influences how much money banks can create through lending. When the Fed lowers interest rates, borrowing becomes cheaper. More loans get taken out. More money enters the economy. M2 goes up.
When the Fed raises interest rates, borrowing gets more expensive. Fewer loans get made. Money creation slows down. M2 growth decelerates.
There’s something else to understand. The US dollar is the world’s reserve currency. That means most global trade (oil, commodities, international contracts) is priced and settled in dollars.
The world needs dollars to function. This global demand means the US must create new dollars. However, to the benefit of the US, the consequences of that money creation gets spread across the globe, rather than being felt just at home.
Imagine this scenario.
You make $100,000 a year. Your employer gives you a 3% raise each year. That sounds pretty good.
But here’s the part nobody talks about at your annual review: the money supply is growing at 6.63% per year.
That means the dollars you’re being paid in are losing value more than twice as fast as your raise is compensating for. Your nominal paycheck goes up. Your raise might be greater than consumer price inflation. However, your real purchasing power goes down.
In the short run, this is barely noticeable. A fraction of a percent here and there doesn’t feel like much.
But compounding works in both directions. Over 30 years, the gap between your wage growth and M2 growth becomes enormous. The dollar you earned in 1990 and the dollar you earn today have the same face value. But they are not the same dollar.
(Read more on why your paycheck isn’t keeping up anymore)
If a 3% raise is losing ground to 6.63% M2 growth, imagine what a savings account earning 0.5% interest is doing.
Money sitting in a traditional savings account isn’t just standing still. It’s actively losing purchasing power every single year. Saving money and building wealth are not the same thing.
When new money enters the economy, it doesn’t land evenly across everyone’s bank account. It flows first through the financial system (banks, institutions, large investors) before trickling down to everyday people (or they just hoard it for themselves).
This is exactly what happened after the Covid-19 pandemic in 2020.
All of that extra money ends up in assets such as stocks, real estate, and commodities.
This is why asset prices tend to rise faster than wages. When more money chases the same number of houses or shares of stock, prices go up. That’s not always because the underlying asset became more valuable. Sometimes it’s just because there are more dollars competing to buy it.
Think about what this means for two different people:
Person A owns a home, has a stock portfolio, and holds some gold. When M2 grows at 6.63% per year, their assets tend to go up in value along with (or faster than) the money supply.
Person B rents an apartment, has most of their money in a savings account, and doesn’t own much in the way of investments. When M2 grows, their rent goes up, their savings lose purchasing power, and they don’t have assets rising in value to offset it.
Both people live in the same economy. But M2 growth treats them very differently.
This is why the wealth cap in the United States has continued to widen. The average person is making just enough money to keep up with inflation, while those with assets are able to compound their wealth.
It’s not about who is working harder. It’s about who owns assets that benefit from monetary expansion and who doesn’t.
The Consumer Price Index (CPI) is the government’s main tool for measuring inflation. It tracks the price of a basket of everyday goods and services like food, housing, gas, and clothing.
CPI is useful, but it has limitations.
From 1972 to 2024, CPI grew at a CAGR of 3.94% per year. The M2 money supply grew at 6.63% per year. That’s a gap of nearly 3% per year, every year, for over 50 years.
So where did the difference go?
A big chunk of it went into asset prices. Stocks, real estate, and other investments absorbed a lot of the new money before it ever showed up as higher prices at the grocery store. CPI doesn’t track asset prices. So it misses a significant portion of what monetary expansion actually does to the economy.
When someone tells you “inflation is only 3%,” they’re probably referring to CPI. But if your rent went up 8%, your healthcare costs rose 10%, and the house you’ve been saving to buy is 40% more expensive than it was five years ago, does 3% feel accurate?
M2 growth gives you a more complete picture of how fast the purchasing power of your dollar is actually declining. It’s not perfect either. But it captures something CPI doesn’t: the rate at which the dollar itself is being diluted.
When the money supply expands, a few things typically happen:
Asset prices rise. More dollars chasing the same assets pushes prices up. Stocks, real estate, and commodities tend to benefit.
Borrowing gets cheaper. Low interest rates (which often accompany M2 expansion) make it easier to take out loans for homes, businesses, and investments.
The dollar weakens. More dollars in existence means each one is worth a little less relative to other currencies and to real goods.
Consumer prices eventually rise. The inflation you feel at the grocery store tends to follow monetary expansion with a delay. It doesn’t always happen immediately, but history shows it usually arrives (Covid-19 recovery stimulus and checks did exactly this).
M2 doesn’t shrink often. But it does slow down, and occasionally it contracts slightly (as it did in 2022 and 2023 when the Fed raised interest rates aggressively).
When M2 slows or shrinks:
Asset prices can fall. Less money in the system means less demand for stocks and real estate. Prices can drop.
Borrowing gets more expensive. Higher interest rates mean fewer loans, less spending, and less economic activity.
The economy can slow or contract. This is why the Fed is so careful about tightening too fast. Slowing money growth can tip the economy into recession.
The dollar tends to strengthen. Fewer dollars in circulation means each one is relatively more valuable.
This is the fundamental tension at the heart of modern monetary policy: grow M2 too fast and you debase the currency. Slow it down too much and you risk recession. The Federal Reserve is constantly trying to balance the two.
The most important shift in thinking M2 teaches you is this: keeping money in cash or low-interest accounts isn’t “safe.” It’s a slow loss.
If the money supply grows at 6.63% per year and your savings account earns 0.5%, you are losing ground at roughly 6% per year in real terms. The balance goes up. The purchasing power goes down.
Once you understand that, the question changes from “how do I keep my money safe?” to “how do I make my money grow faster than the money supply?”
How to think about investing in a high debt to GDP world
Historically, certain asset classes have kept pace with or outpaced M2 growth over long periods of time:
US Stocks. From 1972 to 2024, the broad US market grew at a CAGR of 10.89%, well above M2’s 6.63%. Certain equity styles did even better. (See the full breakdown of US Equity Style Returns Since 1972)
Real Estate. Property values in most markets have risen alongside (and often ahead of) monetary expansion over time.
Commodities and Hard Assets. Gold and other commodities have historically served as a hedge against currency debasement, though they come with their own volatility.
None of this is a guarantee. Past performance doesn’t promise future results. And the economic conditions of the last few years (high debt to GDP, rising interest rates, global uncertainty) are different from the conditions that produced those historical returns.
The point isn’t “buy stocks and get rich.” The point is that understanding M2 helps you ask better questions about where to put your money and why.
What is the M2 money supply in simple terms? M2 is the total amount of money in the US economy that can be quickly converted to cash and spent. It includes physical cash, checking accounts, savings accounts, and money market funds.
Why does the M2 money supply keep growing? Because our economy is built on constant growth. Governments spend, banks lend, and businesses expand. All of that requires more money to exist in the system. The Federal Reserve manages this process through monetary policy.
What is currency debasement? Currency debasement is what happens when more money gets created without a corresponding increase in real goods or services. Each dollar you hold becomes worth slightly less because there are more dollars competing for the same things.
What is the CAGR of the M2 money supply since 1972? From 1972 to 2024, the M2 money supply grew at a CAGR of 6.63% per year.
How is M2 different from inflation (CPI)? CPI measures price changes for everyday goods and services. M2 measures the total growth of money in the economy. M2 growth often leads to price inflation, but a lot of it also shows up in rising asset prices (stocks, real estate) which CPI doesn’t capture. That’s why M2 gives a more complete picture of how fast the dollar is losing value.
Does M2 growth cause wealth inequality? It contributes to it, yes. New money flows first into the financial system and into asset prices. People who own assets (stocks, real estate) benefit. People who hold cash or rent rather than own get left behind. This dynamic has been one of the major drivers of the widening wealth gap since 1971.
What happens to my savings account when M2 grows? Your balance stays the same but its purchasing power shrinks. If M2 grows at 6.63% per year and your savings account earns 0.5%, you’re losing roughly 6% of your real purchasing power every year without even realizing it.
Is M2 growth tied to the US dollar being the world reserve currency? Yes, in a significant way. Because the entire world needs dollars to conduct trade, the US has more room to expand its money supply than most countries. Global demand absorbs some of the new dollars before they show up as domestic inflation. Whether that arrangement is sustainable long term is one of the most important economic questions of our time.
What can the average person do about M2 growth? You can’t stop it. But you can account for it. Understanding M2 helps you realize that keeping money in cash or low-interest accounts isn’t neutral. It’s a slow loss. Historically, investing in assets like stocks and real estate has been one of the most accessible ways for regular people to keep pace with monetary expansion over time.
Does the M2 money supply ever shrink? Rarely, but yes. In 2022 and 2023, M2 actually contracted slightly as the Federal Reserve raised interest rates aggressively. When M2 slows or shrinks, asset prices can fall, borrowing gets more expensive, and the economy tends to slow down. It’s a reminder that the Fed is always balancing two risks: too much money creation debases the currency, and too little can trigger a recession.