US Equity Style Returns (2013 – 2020): The ZIRP ERA
In 2013, the United States’ Debt to GDP ratio officially hit 100%. This meant that the total debt of the US was equal to its total economic output.
The Federal Reserve was already several years into ZIRP (Zero Interest Rate Policy). The Fed had cut rates to zero percent for the first time in US history. They believed ZIRP was needed because of the fallout of the Great Financial Crisis in 2008.
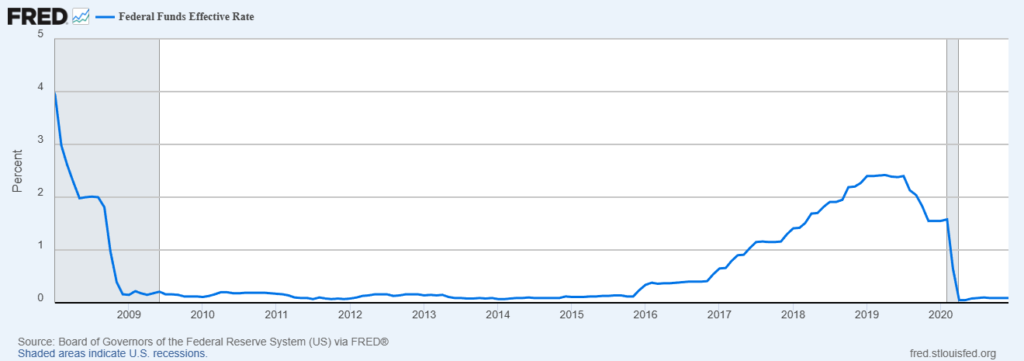
What followed was a period of time where it had never been cheaper to borrow money.
Let’s take a look at how US Equity Styles performed during this era.
US Equity Style CAGR Performance (2013-2020)
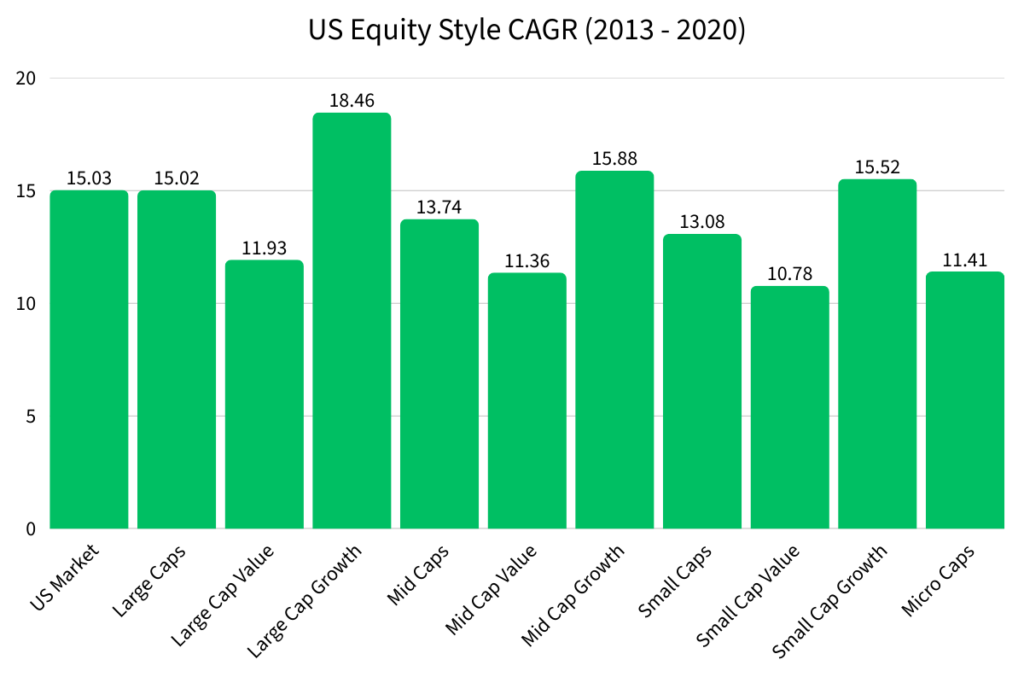
All US Equity Styles had double digit CAGRs from 2013 to 2020.
Which US Equity Style Had the Highest CAGR from 2013 – 2020?
Large Cap Growth had the highest CAGR at 18.46%.
Interest rates were at historically low levels from 2013 to 2020, which allowed investors to borrow cheaply and invest in the large tech companies that dominated the market.
These same tech companies were also just in the midst of the data collection revolution that we live in today.
Which US Equity Style Had the Lowest CAGR from 2013 – 2020?
Small Cap Value had the lowest CAGR at 10.78%.
The US Equity Style that had the best CAGR from 1972 to 2012, had the worst CAGR from 2013 to 2020.
If you think about what was happening in the US economy at the time, it makes sense as to why Small Cap Value lagged behind.
Low interest rates typically mean that investors are more likely to take risks with their investments. A cheap, small company doesn’t have the same risk-reward as a large company with massive growth potential.
US Equity Style Nominal Returns of $10,000 (2013 – 2020)
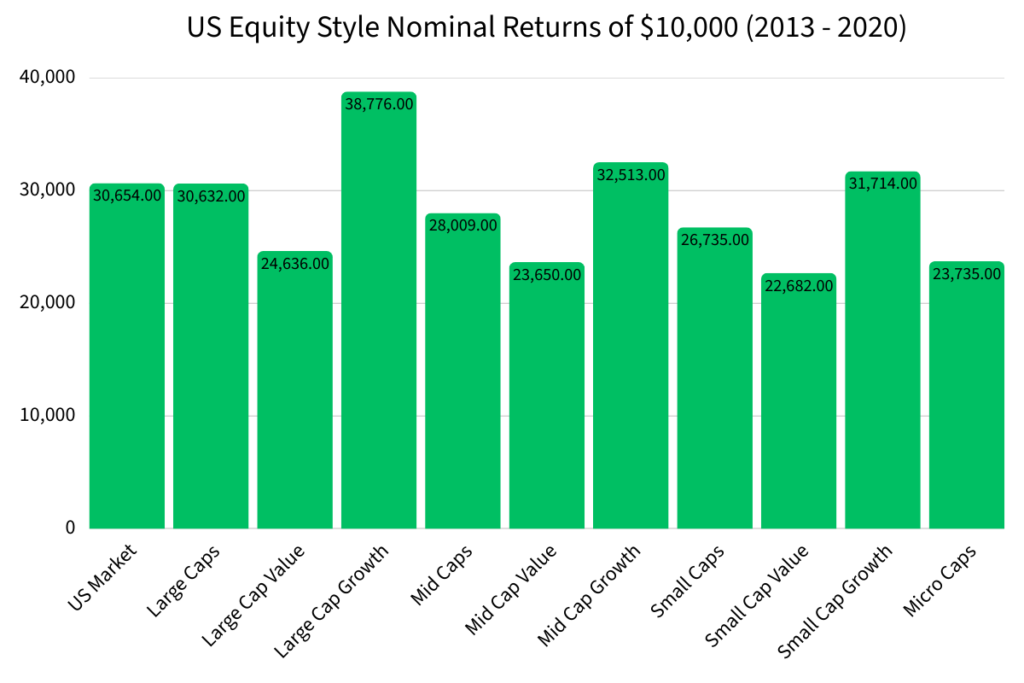
Analyzing CAGRs is one thing, but let’s look at what investing $10,000 into each US Equity Style would have returned until 2020. This assumes that only $10,000 was invested and it was left alone to collect dividends.
Let’s analyze the nominal returns of Large Cap Growth and Small Cap Value to understand the importance of CAGRs.
Large Cap Growth had a CAGR of 18.46%.
$10,000 with an interest rate of 18.46% from 2013 to 2020 would have provided a nominal return of $38,776.
Small Cap Value had a CAGR of 10.78%.
$10,000 with an interest rate of 10.78% from 2013 to 2020 would have provided a nominal return of $22,682.
The difference in nominal returns was $16,094!
| US Equity Style (2013 – 2020) | CAGR | Nominal Returns of $10,000 |
|---|---|---|
| US Market | 15.03% | $30,654 |
| Large Caps | 15.02% | $30,632 |
| Large Cap Value | 11.93% | $24,636 |
| Large Cap Growth | 18.46% | $38,776 |
| Mid Caps | 13.74% | $28,009 |
| Mid Cap Value | 11.36% | $23,650 |
| Mid Cap Growth | 15.88% | $32,513 |
| Small Caps | 13.08% | $26,735 |
| Small Cap Value | 10.78% | $22,682 |
| Small Cap Growth | 15.52% | $31,714 |
| Micro Caps | 11.41% | $23,735 |
US Equity Styles CAGR Compared to US Market CAGR (2013 – 2020)
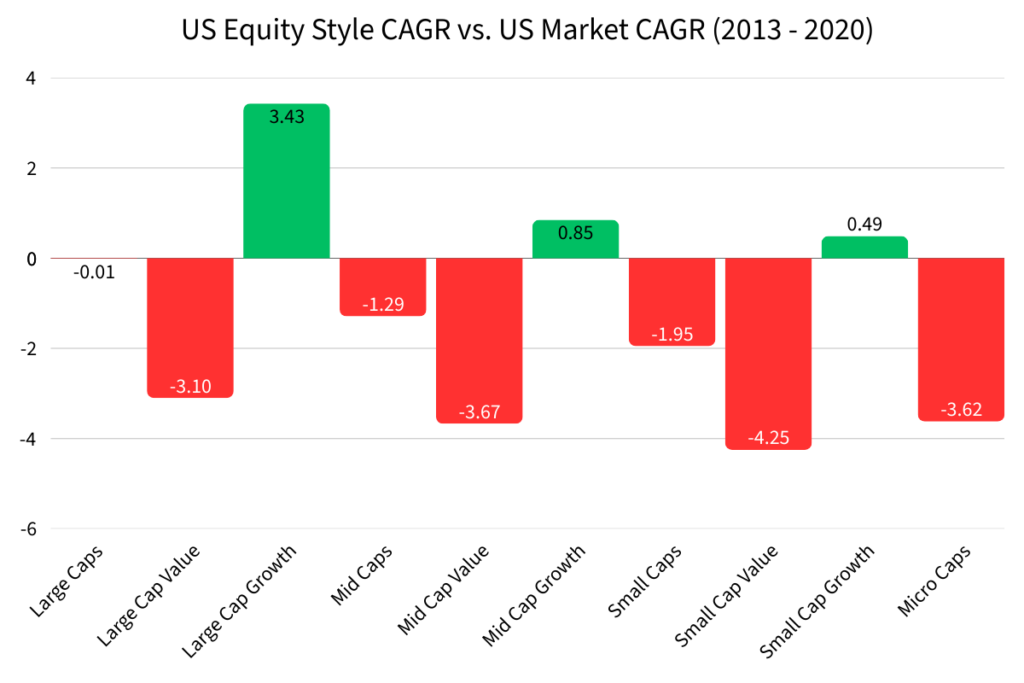
The US Market had a CAGR of 15.03% from 2013 to 2020.
Here’s how each US Equity Style’s performance compared to the US Market.
Which US Equity Styles Outperformed the US Market? (2013 – 2020)
Large Cap Growth (3.43%), Mid Cap Growth (0.85%), and Small Cap Growth (0.49%) all outperformed the US Market from 2013 to 2020.
This makes sense because growth companies tend to do better when interest rates are low. Investors are willing to risk more when money is cheap.
Which US Equity Styles Underperformed the US Market? (2013 – 2020)
Small Cap Value (-4.25%), Mid Cap Value (-3.67%), Micro Caps (-3.62%), Large Cap Value (-3.10%), Small Caps (-1.95%), Mid Caps (-1.29%), and Large Caps (-.01%) all underperformed the US Market from 2013 to 2020.
Value companies tend to underperform growth when interest rates are low. When borrowing costs are near zero, investors take bigger risks for future profits instead of locking in profits for the present.
| US Equity Style | Outperformance vs. US Market (2013 – 2020) |
|---|---|
| Large Caps | -.01% |
| Large Cap Value | -3.10% |
| Large Cap Growth | 3.43% |
| Mid Caps | -1.29% |
| Mid Cap Value | -3.67% |
| Mid Cap Growth | .85% |
| Small Caps | -1.95% |
| Small Cap Value | -4.25% |
| Small Cap Growth | .49% |
| Micro Caps | -3.62% |
US Equity Style CAGR Compared to CPI CAGR (2013 – 2020)
Next, let’s compare the CAGRs of each US Equity Style to the CAGR of the Consumer Price Index (CPI).
In 2013, CPI was 234.7.
In 2020, CPI was 262.
CPI’s CAGR was 1.58% from 2013 to 2020. This is a measurement of the average increase of the cost of living.
Here’s how each US Equity Style performed compared to CPI.
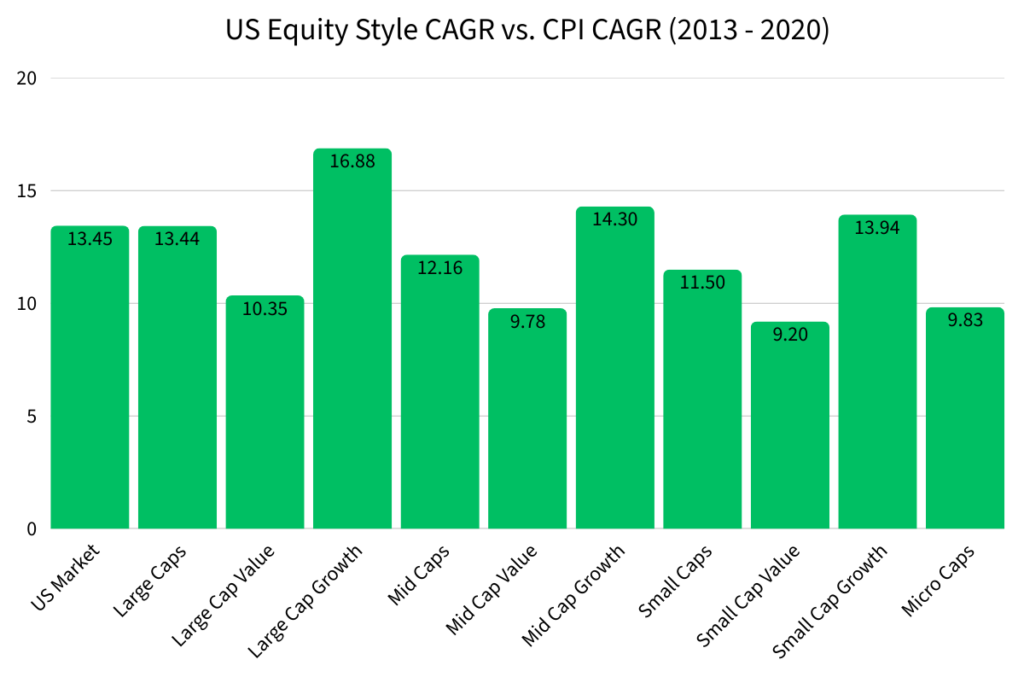
Every US Equity Style outperformed CPI from 2013 to 2020.
CPI was historically low from 2013 to 2020.
US Equity Style CAGR Compared to M2 Money Supply CAGR (2013 – 2020)
Lastly, let’s compare US Equity Styles to the M2 Money Supply.
In 2013, the M2 Money Supply was $11.04 trillion.
In 2020, the M2 Money Supply was $19.10 trillion.
The M2 Money Supply had a CAGR of 8.15% from 2013 to 2020.
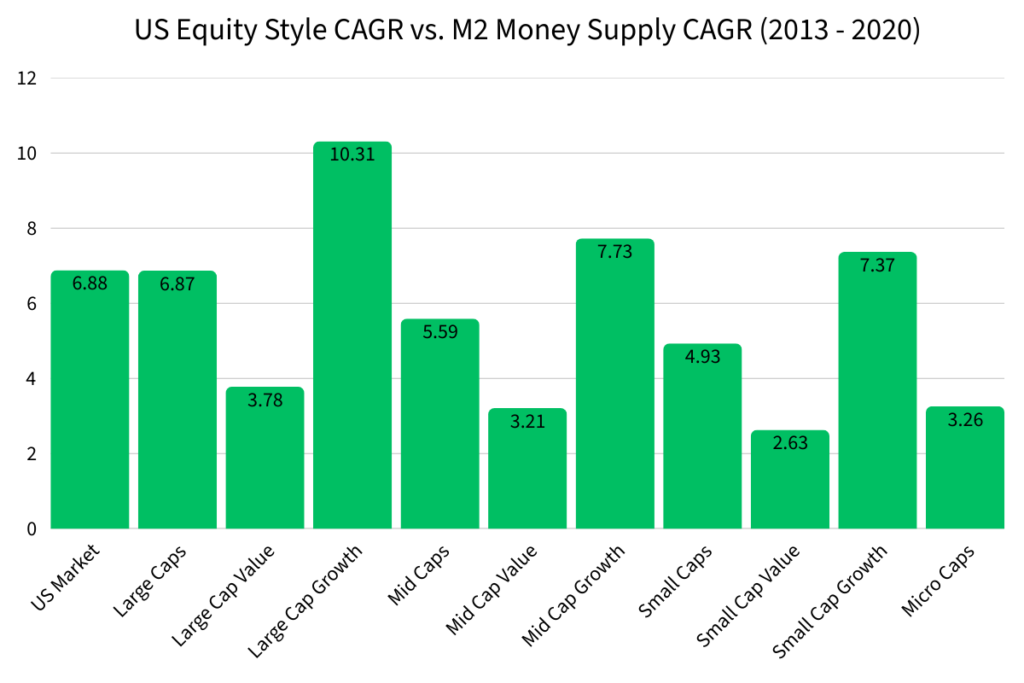
Here we see the real wealth generated by US Equity Styles from 2013 to 2020.
The M2 Money Supply measures the amount of total dollars in use in the US. A CAGR of 8.15% means that the dollar was debased by 8.15% compounded annually from 2013 to 2020.
Comparing CAGR returns to the M2 Money Supply is important because this is what shows the real wealth generated by your investments.
For example, if you invested in a company that had a CAGR of 8.15%, you might be happy with those returns. However, if the M2 Money Supply also had a CAGR of 8.15%, your investment just kept up with the rate of debasement. There was no real wealth created.
Fortunately, each US Equity Style outperformed the CAGR of the M2 Money Supply. However, the Large Cap Value (3.78%), Mid Cap Value (3.21%), Small Cap Value (2.63%), and Micro Caps (3.26%) lagged behind growth.
| US Equity Styles (2013 – 2020) | Outperformance vs. CPI CAGR | Outperformance vs. M2 Money Supply CAGR |
|---|---|---|
| US Market | 13.45% | 6.88% |
| Large Caps | 13.44% | 6.87% |
| Large Cap Value | 10.35% | 3.78% |
| Large Cap Growth | 16.88% | 10.31% |
| Mid Caps | 12.16% | 5.59% |
| Mid Cap Value | 9.78% | 3.21% |
| Mid Cap Growth | 14.3% | 7.73% |
| Small Caps | 11.5% | 4.93% |
| Small Cap Value | 9.2% | 2.63% |
| Small Cap Growth | 13.94% | 7.37% |
| Micro Caps | 9.83% | 3.26% |
What Can We Learn From How US Equity Styles Performed From 2013 to 2020?
The biggest thing to take away from how US Equity Styles performed from 2013 to 2020 is that interest rates are a major influence on what equity styles perform the best.
Growth companies were able to have massive returns because the Federal Reserve made money as cheap as it had ever been in US history. Zero percent interest rates allowed investors to borrow cheaply and invest in growth companies that had the potential to deliver huge returns in the future.
There was no reason to invest in value companies because the typical advice of investing in cheap, undervalued companies didn’t apply when rates were so low.
In the present day, if the Federal Reserve decides to cut rates does that mean just go long in all growth companies? Will history repeat again?
The difference between today and 2013 to 2020 is that the US Debt to GDP ratio is over 120%. From 2013 to 2020, the ratio was hovering around 100%. So we are in uncharted territory when it comes to investing.
I think that if the Federal Reserve cuts interest rates back to near zero levels, growth companies will do well, but the real winner will be hard assets such as: gold, silver, land, etc.