Equity Returns (1986 to 2025): US vs. International Markets
For decades, traditional investing advice has told people to diversify internationally. The idea sounds smart on the surface. Don’t put all of your eggs in one basket.
But what does the actual data say?
This article will analyze how US and international stocks have performed since 1986 (the first year standardized international market data became available). First we’ll look at nominal returns. Then we will compare US and international stocks to CPI, M2, and gold. Lastly, we’ll discuss correlation and whether or not international stocks are true diversification for your portfolio.
As always this is not financial or investment advice.
TL;DR – Key Takeaways
Standardized international market data only became available in 1986 when MSCI launched its major indices.
From 1986 to 2025, the US Market had a CAGR of 11.06% per year.
International markets lagged significantly: Developed International (7.43%), European (8.84%), Pacific (5.92%).
Every market outperformed M2 money supply growth (5.34% CAGR) from 1986 to 2025, but Pacific barely cleared it at 0.56% above M2.
Gold outperformed both CPI (5.52%) and M2 (5.34%) but only barely, and lagged all equity markets significantly.
Correlation tells you how closely two investments move together. Developed International had a correlation of 0.72 with the US market, meaning it moves in the same direction most of the time. Gold had a correlation of -0.02, meaning it moves almost independently.
High correlation between the US and international markets raises a real question: are you actually diversifying, or just owning more of the same thing?
- TL;DR – Key Takeaways
- A Brief History of International Investing
- The Three Major International Indices (1986)
- CAGR Performance: US vs. International (1986 to 2025)
- Did International Stocks Beat the Shrinking Dollar?
- What Is Correlation and Why Does It Matter?
- So Should You Have Just Invested in the US?
- Why International Diversification Still Makes Sense
- Frequently Asked Questions
A Brief History of International Investing
Before 1986: A Messy and Expensive Process
International investing did not begin in 1986, but what existed before then looked almost nothing like what investors have access to today.
In 1969, a company called Capital International (part of The Capital Group) created the EAFE index (Europe, Australasia, and Far East). They built it because they wanted to invest internationally but could not find reliable data anywhere, so they built their own.
For US investors in the early 1970s, buying foreign stocks was possible but almost not even worth it. From 1972 to 1974, any US investor who bought foreign stocks was hit with an extra 15% tax on the purchase price. This was called the Interest Equalization Tax (IET) and it was designed specifically to keep American money at home rather than flowing overseas.
The IET was repealed in 1974. If you wanted to buy foreign stocks, you had to use a stockbroker who would pick foreign companies for you. The stockbrokers charged high fees and you had to trust that they would make the best decisions for you.
The First Step Toward Accessibility
In 1981, Vanguard launched the International Growth Fund (VWIGX). This was a meaningful step forward. It gave US investors a lower-cost way to get international exposure without picking individual stocks themselves.
However, this fund was still actively managed. Fund managers were actively buying and selling foreign stocks. They weren’t tracking any index. This meant higher costs and more room for human error.
1986: The Year Everything Changed
In 1986, Morgan Stanley bought the data rights from Capital International and rebranded as MSCI (Morgan Stanley Capital International).
For the first time, there was standardized, consistent, publicly available data tracking international markets through named indices. That made it possible to build index funds around international markets the same way they had been built around US markets.
1986 is the starting point for all of the return data in this article.
Note: Performance data prior to 1992 represents theoretical academic research (Fama-French Data Library) rather than actual investable funds. Real investors during this period relied on active managers who faced transaction costs and fees not captured in this data. Pre-1996 international data also typically represents the MSCI EAFE Index (Developed Markets only) and does not include Emerging Markets, which were added to standard retail funds later.
The Three Major International Indices (1986)
When MSCI launched in 1986, three major indices formed the foundation of international investing. Here is what each one covers, along with a reference ETF for your own research. (These are not recommendations, just starting points.)
Developed International (MSCI EAFE)
Wealthy, industrialized, and economically stable countries outside the US. Think Japan, the United Kingdom, and Canada.
These are countries with established financial markets, rule of law, and relatively stable governments. They are considered lower risk than emerging markets but they do not have the same growth potential either.
Reference ETF: VEA
European Markets (MSCI Europe)
Mostly developed Western European countries. Germany, France, and the United Kingdom make up a large portion of this index.
Reference ETF: VGK
Pacific Markets (MSCI Pacific)
Developed Pacific countries including Japan, Australia, and South Korea.
Japan makes up a significant portion of this index, which matters because Japan has had a complicated economic story since the early 1990s (more on that when we get to the returns data).
Reference ETF: VPL
Note: If you use Portfolio Visualizer, you may notice that in 1986 “Global ex-US” and “Developed International” looked almost identical. That is because emerging market indices did not exist yet. In a future article on Unmasked Economics, we will separate these categories once the data allows for it (roughly 1995 onward).
CAGR Performance: US vs. International (1986 to 2025)
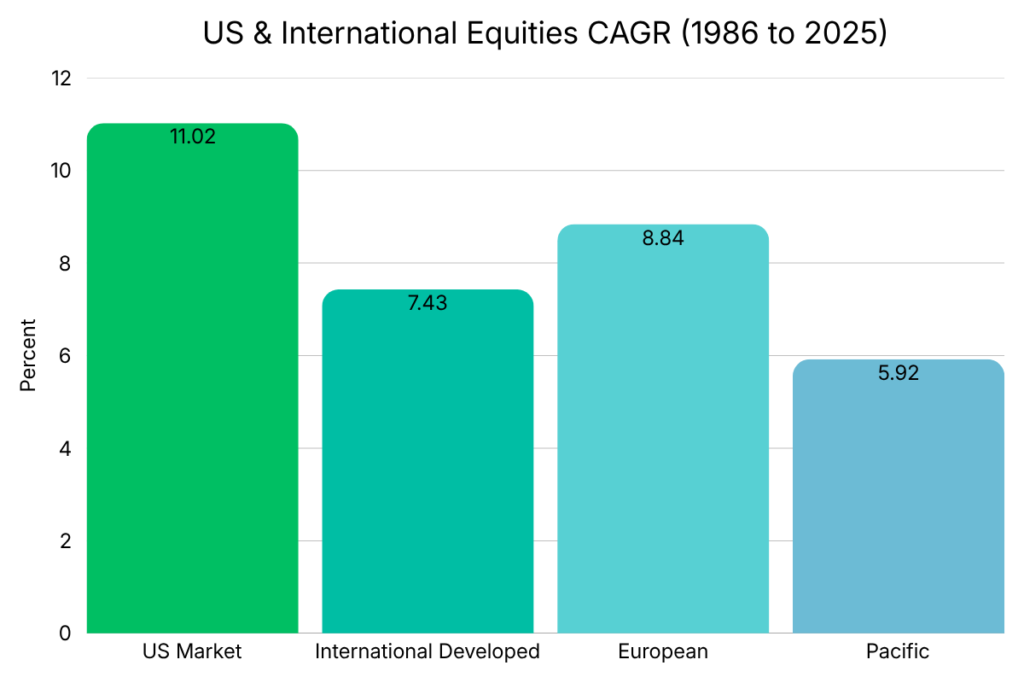
The US Market Ran Away From the Pack
The US Market posted a CAGR of 11.02% from 1986 to 2025. Every international market and gold trailed it by a wide margin.
| Market | CAGR (1986 to 2025) | vs. US Market |
|---|---|---|
| US Market | 11.02% | – |
| International Developed | 7.43% | -3.59% |
| European | 8.84% | -2.18% |
| Pacific | 5.92% | -4.92% |
The smallest gap was between the US and European markets at -2.18%. Gold and Pacific markets both trailed the US by roughly 5%, representing enormous differences in real dollar outcomes over 39 years.
Those might look like small numbers. They are not. As we are about to show you, small CAGR differences compound into enormous dollar differences over time.
The $425,000 Gap
Let us make the CAGR numbers real.
Imagine you invested $10,000 in the US Market and another $10,000 in Developed International stocks in 1986. You did not touch either investment. No additional contributions. Just let it sit and compound for 39 years.
Here is where you would be today:
| Investment | CAGR | $10,000 Grew To |
|---|---|---|
| US Market | 11.02% | $588,562 |
| Developed International | 7.43% | $163,105 |
| European | 8.84% | $248,400 |
| Pacific | 5.92% | $103,141 |
| Difference (US vs. Developed Intl) | $425,457 |
A 3.59% difference in CAGR between the US Market and Developed International turned into a $425,000 gap in actual money over 39 years.
Gold and Pacific markets performed similarly to each other in dollar terms, both growing $10,000 to just over $100,000. Compare that to the US Market’s $588,000 and you begin to see how much the choice of where to invest matters over long time horizons.
Did International Stocks Beat the Shrinking Dollar?
Measuring Returns Against M2 and CPI
A return that looks good on paper might not be building real wealth if the money supply is expanding faster than your investments are growing.
From 1986 to 2025, the M2 money supply grew at a CAGR of 5.34% per year and CPI grew at 5.52% per year. (For a full breakdown of what M2 is and why it matters, read my article on The M2 Money Supply.)
Any investment that did not beat those benchmarks was not actually growing your purchasing power. It was just keeping pace with (or losing ground to) dollar dilution.
Here is how each market stacked up:
| Market | CAGR | vs. CPI (5.52%) | vs. M2 (5.34%) |
|---|---|---|---|
| US Market | 11.02% | +5.50% | +5.68% |
| Developed International | 7.43% | +1.91% | +2.09% |
| European | 8.84% | +3.32% | +3.50% |
| Pacific | 5.92% | +0.40% | +0.58% |
The Pacific Warning Sign
Developed International and European stocks outperformed CPI, M2, and gold by multiple percentage points. However, Pacific stocks barely beat CPI and M2, and actually underperformed gold.
Pacific stocks outperformed M2 by just 0.58% and CPI by just 0.40%. They also underperformed gold by -0.18%. Which raises the question, how were Pacific stocks unable to beat a metal in the ground that doesn’t produce any value?
US equities outperformed M2 by 5.68% and CPI by 5.50%. That gap represents genuine, substantial wealth creation above and beyond dollar dilution.
What Is Correlation and Why Does It Matter?
Correlation Explained in Plain English
Correlation is a number between -1 and 1 that tells you how closely two investments move together.
Here is the simplest way to think about it:
- A correlation of 1.0 means two investments move in perfect lockstep. When one goes up 10%, the other goes up 10%. They are essentially the same thing.
- A correlation of 0 means two investments have no relationship at all. When one goes up or down, the other does whatever it wants independently.
- A correlation of -1.0 means two investments move in perfect opposite directions. When one goes up 10%, the other goes down 10%.
Most investments fall somewhere in between. Correlation matters for investors because it shows whether you are buying something that offers true diversification or something that just moves with the market.
The Correlation Problem With International Diversification
Here are the correlations of each market to the US Market from 1986 to 2025, measured using Portfolio Visualizer:
| Market | Correlation to US Market | What It Means |
|---|---|---|
| Developed International | 0.72 | Moves closely with the US |
| European | 0.79 | Moves very closely with the US |
| Pacific | 0.57 | Moderate relationship with the US |
| Gold | -0.02 | Moves almost independently of the US |
A 0.72 correlation between Developed International and the US market means that in most market conditions, when the US market rises do international developed stocks. They don’t move perfectly together, but in general they move in the same direction most of the time.
When the 2020 Covid-19 pandemic hit, US and international stocks dropped between -29% to -37%. Gold only dropped -7%. International diversification didn’t do anything because they crashed alongside the US market. When you needed diversification the most, it didn’t do anything.
Does High Correlation Mean International Diversification Is Pointless?
A 0.72 correlation is not a 1.0 correlation. There is still some independent movement, which means international stocks do provide some diversification benefit. For example, international stocks outperformed the US in the 2000s.
However, it does mean the diversification benefit is smaller than most people assume when they hear “invest internationally.” You are not buying something that zigs when the US zags. You are buying something that mostly moves in the same direction, just not always by the same amount.
The honest question to ask yourself is: if international developed stocks have a 0.72 correlation to the US market and a significantly lower long-term return, what exactly am I getting for accepting that lower return?
Lower valuations in some markets. Exposure to different currencies. Different sector weightings. Some independent movement. Whether those benefits justify the return gap is something every investor has to decide for themselves.
So Should You Have Just Invested in the US?
Looking Back, the Answer Looks Obvious
With hindsight, yes. An investor who put everything into the US Market in 1986 and ignored international diversification would have come out dramatically ahead in terms of raw returns.
The data is clear.
But Here Is the Problem With That Thinking
No one knows what the future holds.
Investors in 1986 were making decisions with 1986 information. And in 1986, there were plenty of reasonable arguments for international diversification.
That is the honest truth about hindsight-based investing. The right answer is always obvious after the fact.
Why International Diversification Still Makes Sense
You Are Making a Bet Either Way
Here is the thing most financial articles skip: choosing to invest only in the US is just as much of a bet as choosing to diversify internationally.
If you go all-in on the US, you are betting that the conditions that made the US the best-performing major market from 1986 to 2025 will continue for the future.
Some questions worth sitting with:
- What if the next generation of world-changing companies comes from outside the US?
- What if the US enters a prolonged recession while other economies do not?
- What if the US dollar weakens significantly as a global reserve currency?
- What if geopolitical shifts change which economies are growing?
None of these are predictions. They are just possibilities. And they are the reason international diversification still has a logical argument behind it even when the historical data does not favor it.
What International Diversification Actually Means
At its core, international diversification is an admission: “I do not know which country is going to perform best over the next 30 years, so I am going to spread my bet across all of them.”
Will that strategy produce the highest possible returns? No. The highest possible returns come from correctly picking the best-performing market and going all in. But that requires being right (consistently, over decades) in a way that almost no investor actually manages.
The correlation data in this article adds one more layer to think about. If you are going to diversify internationally, the assets with lower correlation to the US market (like Pacific stocks or gold) offer more genuine diversification benefit than highly correlated ones (like European stocks). Whether the trade-off in returns is worth it is your call to make.
For a look at how different economic eras affect these decisions, check out my article on Investing in a High Debt-to-GDP World.
Frequently Asked Questions
What is correlation in investing?
Correlation is a number between -1 and 1 that measures how closely two investments move together. A correlation of 1.0 means they move in perfect lockstep, while a correlation of -1 means they move in opposite directions. For diversification purposes, lower correlation is generally better because it means the assets do not tend to fall at the same time.
What was the correlation between international stocks and the US market from 1986 to 2025?
Based on Portfolio Visualizer data: Developed International had a correlation of 0.72, European had 0.79, Pacific had 0.57, and Gold had -0.02. The high correlations of Developed International and European stocks to the US market raise a legitimate question about how much true diversification they actually provide.
What is the MSCI EAFE index?
MSCI EAFE stands for Europe, Australasia, and Far East. It tracks developed international markets outside the US and Canada and is the most widely used benchmark for international developed market performance. ETFs like VEA are built around it.
When did standardized international investing begin?
In 1986, when Morgan Stanley acquired Capital International’s data and launched MSCI (Morgan Stanley Capital International). Before that, international investing was expensive, inconsistent, and relied on active managers who charged high fees.
What was the CAGR of international markets from 1986 to 2025?
Developed International returned 7.43%, European returned 8.84%, Pacific returned 5.92%.
Did international stocks beat inflation and dollar dilution from 1986 to 2025?
Yes, but some barely. Pacific stocks outperformed M2 (5.34%) by only 0.56%.
What is the difference between Developed International and Global ex-US?
Developed International (MSCI EAFE) tracks only wealthy, stable, industrialized countries. Global ex-US also includes Emerging Markets like China, India, and Brazil. Before the mid-1990s these two categories looked almost identical because emerging market indices did not exist yet.
Why did Pacific markets underperform so significantly?
Japan makes up a large portion of the Pacific index. Japan’s economy experienced a massive asset bubble that peaked in 1989 followed by decades of slow or stagnant growth. That prolonged underperformance dragged down the Pacific index’s overall CAGR significantly.
How do I invest in international markets?
The simplest way is through low-cost index ETFs. VEA covers Developed International, VGK covers European markets, and VPL covers Pacific markets. These are starting points for your own research, not recommendations.