More investors are looking into RSP as a way to protect themselves against a market that is heavily concentrated at the top. As of June 2026, the top ten companies in the S&P 500 make up 39% of the index. A handful of mega-cap tech companies are driving most of the returns.
RSP spreads exposure equally across all 500 companies so no single stock can dominate your portfolio. Investing in RSP seems safer when thinking about market concentration risk.
Is it really? Does RSP offer better diversification? What about its returns?
Here’s the short answer. RSP underperformed SPY, got hit harder in crashes, and underperformed gold.
This article will look at the historical returns of RSP since inception (May 2003) to December 2025 and compare them to not just the S&P 500, but also CPI, M2, and gold.
What Is RSP and How Is It Different From SPY?
RSP is an ETF that tracks the equal weighted S&P 500 index. This means that every company gets roughly 0.2% of the fund. Every quarter it rebalances, systematically selling your winners to fund the laggards. It also costs more to own. RSP has an expense ratio of 0.20% versus SPY’s expense ratio of 0.09%.
SPY tracks the S&P 500 as a market-cap weighted index. The bigger the company, the bigger its slice of the fund. Apple, Microsoft, and Nvidia carry far more weight than a mid-size industrial company, even though they’re all technically in the same index.
[More on what is the S&P 500?]
RSP vs SPY: Who Actually Won Over the Long Run?
SPY won.
From May 2003 through December 2025, SPY delivered a total return of 1,035%. It had a CAGR (compounded annual growth rate, the annualized return that accounts for compounding over the full period) of 11.36%.
RSP delivered a total return of 971%. Its CAGR was 11.07%.
The gap is about 0.29 percentage points per year. Over 22.5 years, that compounds into real dollars.
In nominal dollar terms, $10,000 invested into SPY at the beginning of the time period (without selling, and reinvesting dividends) would have left you with $113,505.
$10,000 invested into RSP during the same time would have left you with $107,110.
That’s a difference of $6,395.
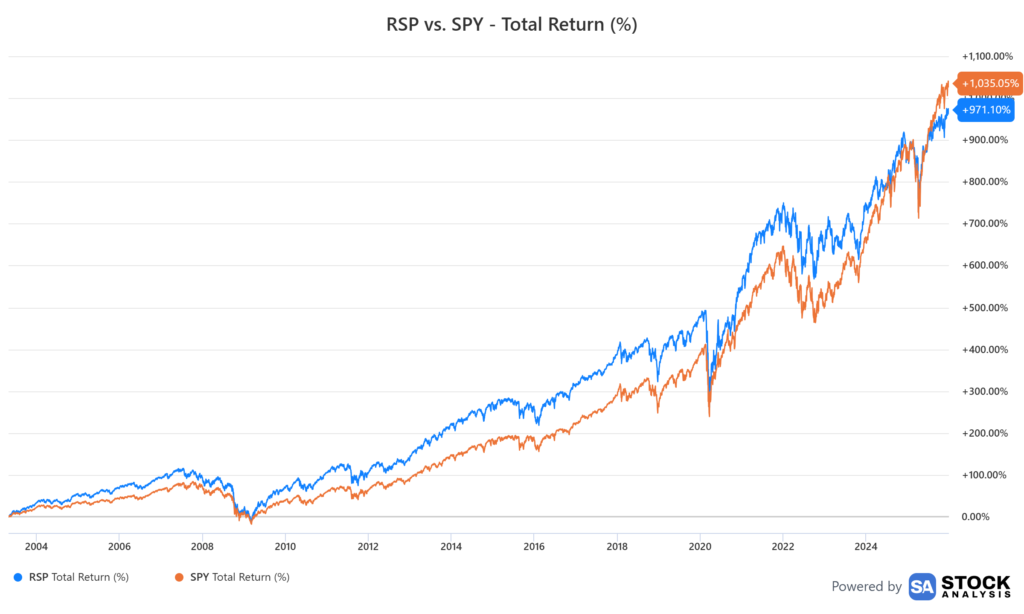
So since inception, RSP has underperformed the S&P 500. This is across different market concentrations, monetary policies, etc.
Part of this comes down to structure. Every month, retirement contributions flow into cap-weighted index funds. Some portion of every 401k contribution automatically goes toward the largest companies in the index just because of how the weighting works. RSP doesn’t get that same tailwind. It treats all 500 companies equally, which means it misses the continuous structural bid pushing the mega-caps higher month after month.
RSP Beat CPI. But Is That the Right Measuring Stick?
CPI (the Consumer Price Index, the government’s official measure of inflation) grew at 2.59% per year over this window. SPY at 11.36% and RSP at 11.07% beat it by a wide margin. RSP dominated CPI over this time period, but that was to be expected. If RSP couldn’t have better returns than the increase in the cost of living, then we’d all be in trouble.
There is a problem though. CPI measures a basket of consumer goods. It doesn’t fully capture what’s happening to asset prices, housing costs, or the money supply itself. When you hear that inflation averaged 2.59% annually over this period, that number is telling you something real. It’s just not telling you everything.
So what happens when you swap in a different measuring stick?
When You Measure Against M2, the Real Gains Look a Lot Smaller
M2 is the measure of the total money supply (all the dollars sitting in checking accounts, savings accounts, and money market funds). From May 2003 to December 2025, M2 went from $5.9 trillion to $22.37 trillion. That’s a CAGR of 6.08% per year.
The money supply nearly quadrupled. The dollars you’re measuring your returns in aren’t the same dollars that existed in 2003. More of them exist now, which means each one is worth a little less.
When you benchmark RSP against M2, it only outperformed by 4.63%. That number represents the true wealth created by RSP.
You’re still making real gains and creating wealth, but comparing your investment to M2 paints a more accurate picture compared to just looking at nominal gains.
[More on the M2 money supply and what it means for your paycheck.]
Gold Outperformed RSP. That’s Worth Asking About.
Gold went from $338.30 per ounce in May 2003 to $4,317.95 at the end of December 2025. Total return of about 1,176%. CAGR of 11.94%.
Gold outperformed RSP (and SPY).
Gold doesn’t produce anything. It doesn’t have any earnings or dividends. It just sits there.
How does a metal that does nothing outperform the best economy in the world’s two most popular index funds for over two decades?
I think about gold as a measure of long term dollar devaluation. Gold doesn’t really go up, the dollar goes down. When the money supply increases as much as it does over time, gold goes up by default. It just takes more devalued dollars to purchase an ounce of gold.
So what does it mean that gold beat the stock market over this window? It’s not really a statement about gold. It’s a question about how much real wealth was actually created during a period when the money supply nearly quadrupled.
Did Equal Weight Actually Protect You When Markets Crashed?
The diversification argument for RSP isn’t just about returns. It’s about protection. Less concentration means a softer landing when things go wrong.
Here’s what actually happened in the three major crashes in this window. I measured the percentage drop from the most recent high before each drawdown to the lowest low.
In 2008 (GFC), SPY fell 57.40%. RSP fell 62.29%.
In 2020 (Covid Pandemic), SPY fell 35.63%. RSP fell 40.69%.
In 2022 (Inflation and Interest Rate Hikes), SPY fell 27.47%. RSP fell 24.25%.
RSP had a bigger drop during the 2008 financial crisis and 2020 Covid crash. RSP didn’t drop as hard as SPY did when inflation started being a problem in 2022.
Here’s why I think RSP didn’t offer much downside protection, especially in 2008 and 2020.
During both of those two downturns, the Federal Reserve cut interest rates to near zero. Who benefits the most from low interest rates? The mega-cap companies. Mega-caps also have access to cash, credit, and are large enough to absorb losses that would destroy mid-cap companies. Passive inflows into SPY keep sending money to the largest companies in the index.
RSP’s structure as an equal-weighted index doesn’t have the same built-in benefits that SPY does.
When the Federal Reserve started raising interest rates to fight inflation in 2022, the mega-caps that were reliant on low interest rates were hurt the most.
At the same time, those interest rate hikes were the fastest increase since the Volcker shock in the early 1980s. Maybe SPY would have done better if the interest rate hikes were slower and not as sharp.
It’s just something to think about.
So What Does the RSP Comparison Actually Tell Us?
From RSP’s inception to the end of 2025, RSP underperformed SPY.
The strategy of selling your winners and rebuying the laggards each quarter couldn’t beat the market.
RSP outpaced the increase in CPI and M2 in nominal terms, but the real returns against M2 were only 4.99%.
RSP didn’t outperform gold as well.
While the nominal CAGR of 11.07% looks good on paper, you have to ask yourself some questions about RSP.
Would RSP really protect you during a downturn if the overall market crashed?
Why am I paying more in expense ratio fees if the market is cheaper and performed better?
How would interest rate changes affect RSP’s performance against the market?
Why didn’t RSP outperform gold (a metal that does nothing)?
FAQ
What is RSP?
RSP is the Invesco S&P 500 Equal Weight ETF. It tracks the same 500 companies as the standard S&P 500 but gives each company an equal share of the fund. It rebalances quarterly to maintain equal distribution.
Has RSP outperformed SPY historically?
Over the May 2003 through December 2025 window, no. SPY had an 11.36% CAGR versus RSP’s 11.07%.
Does RSP protect you better in a market crash?
Not based on this data. RSP fell further than SPY in both the 2008 financial crisis (62.29% vs 57.40%) and the 2020 COVID crash (40.69% vs 35.63%). It held up slightly better in the 2022 rate hike drawdown, which was also the shallowest of the three crashes in this window.
What is M2 and why does it matter for measuring returns?
M2 measures the total money supply (all the dollars in checking accounts, savings accounts, and money market funds). From 2003 to 2025 it grew at 6.08% annually. When you benchmark returns against M2, real wealth gains look smaller because you’re accounting for how much the money supply itself expanded over that period.
Why did gold outperform RSP?
I don’t think gold actually went up. I think the dollar went down. When the money supply nearly quadruples over two decades, it takes more dollars to buy the same ounce of gold. The real productivity gains from RSP were not able to outpace the dollar’s devaluation over this period. That’s how I think about it anyway.
Is RSP a bad investment?
I don’t own RSP. I will most likely never own it because SPY and other S&P 500 ETFs are cheaper, and other asset classes offer better diversification when the market tanks. I’m not a financial advisor and would never tell you what to invest in. That’s your own decision because it’s your money.