US Equity Style Returns (1972 – 2012): The Pre-Debt Crisis
In this article, I will analyze US equity styles from the ending of the gold standard to when the United States eclipsed 100% Debt to GDP in 2012.
This is an important era to study because in 1972, the United States got off of the gold standard. The United States dollar was no longer backed by anything. The dollar became a fiat currency.
This ushered in a new era in global economics.
For the next 40 years, the United States borrowed and printed money in order to fund government expenses. However, in 2012, the US Debt to GDP ratio officially hit 100%.
“Note: Performance data prior to 1992 represents theoretical academic research (Fama-French Data Library) rather than investable mutual funds. Actual investors during this period would have relied on active managers (like the Vanguard Windsor Fund) who faced transaction costs and fees not reflected in this theoretical data.
“Note on Data Sources: The Micro Cap performance shown prior to 1981 represents theoretical academic data (CRSP Decile 10) rather than an investable fund. Returns during this era do not reflect the significant trading costs and liquidity issues regular investors would have faced at the time. From 1981 onward, the data reflects the actual net-of-fee performance of the DFA US Micro Cap Portfolio (DFSCX), the first fund to make this asset class investable.
- US Equity Style CAGR (1972 – 2012): Before Debt to GDP Eclipsed 100%
- US Equity Style Nominal Returns of $10,000 (1972 – 2012)
- US Equity Styles CAGR Compared to US Market CAGR (1972 – 2012)
- US Equity Style CAGR Compared to CPI CAGR (1972 – 2012)
- US Equity Style CAGR Compared to M2 Money Supply CAGR (1972 – 2012)
- What This Period Teaches Us About US Equity Style Returns
US Equity Style CAGR (1972 – 2012): Before Debt to GDP Eclipsed 100%
Each US equity style had a positive CAGR from the period of 1972 to 2012. This meant that no matter what equity style you invested in, you had a positive nominal return.
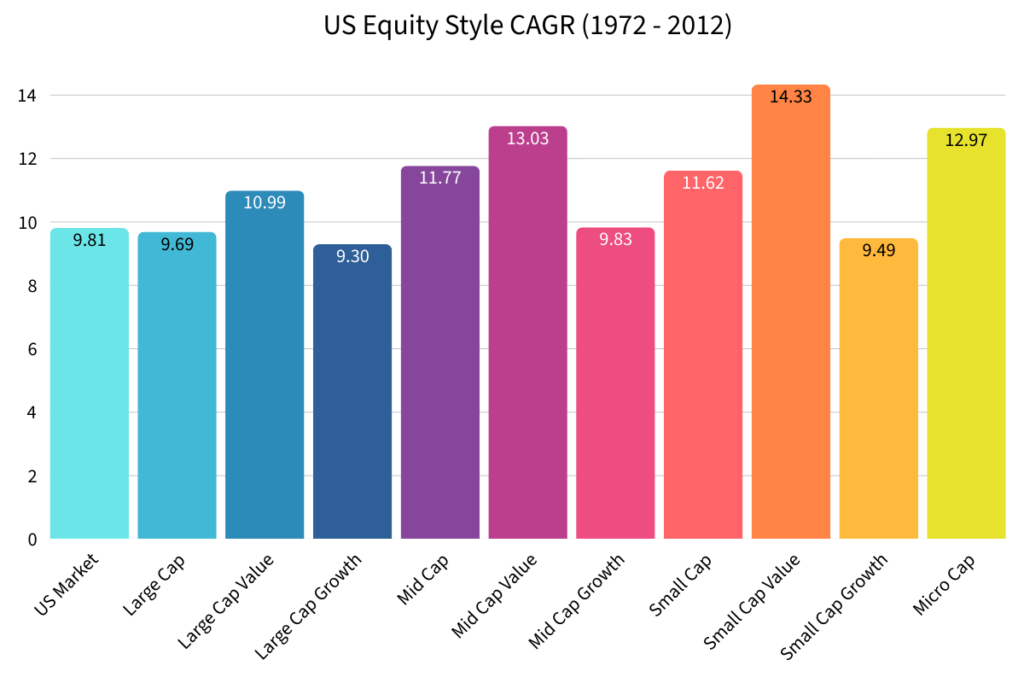
Which US Equity Style Had the Highest CAGR from 1972 – 2012?
The best performing US equity style from 1972 to 2012 was Small Cap Value (14.33%).
When you think about it, this makes sense because the economy in 1972 was completely different than it is today.
Creating a successful small business is difficult no matter what, but the conditions were easier in the 1970s. The USD had yet to be devalued year after year. Consumer prices had yet to compound yearly either.
Today, starting a small business is much more expensive (land, equipment, legal fees, employees, etc.). Entrepreneurs need more devalued dollars to afford more unaffordable products for their business.
So, if you were able to invest in a “cheap” small business that was able to grow over the years, the performance would be wonderful.
Which US Equity Style Had the Lowest CAGR from 1972 – 2012?
The worst performing US equity style was Large Cap Growth (9.30%).
It might be surprising to see that Large Cap Growth had the worst CAGR because today the Large Caps dominate the market. However, don’t forget the economic situations are completely different today.
Large Cap Growth companies need lower interest rates to justify their higher valuations. Interest rates were very high in the 70s and 80s. It wasn’t until 1992 when interest rates reached a level that we are at today (3.75%).
Also, today’s Large Cap Growth companies are much larger and own many more smaller companies.
The laws were also different back in the 1970s. The US government was more concerned with companies becoming monopolies. Today, the US government doesn’t care. This helps Large Cap companies stay dominant.
US Equity Style Nominal Returns of $10,000 (1972 – 2012)
Let’s examine what investing $10,000 into each equity style would have returned if you just let your money sit and reinvest dividends.
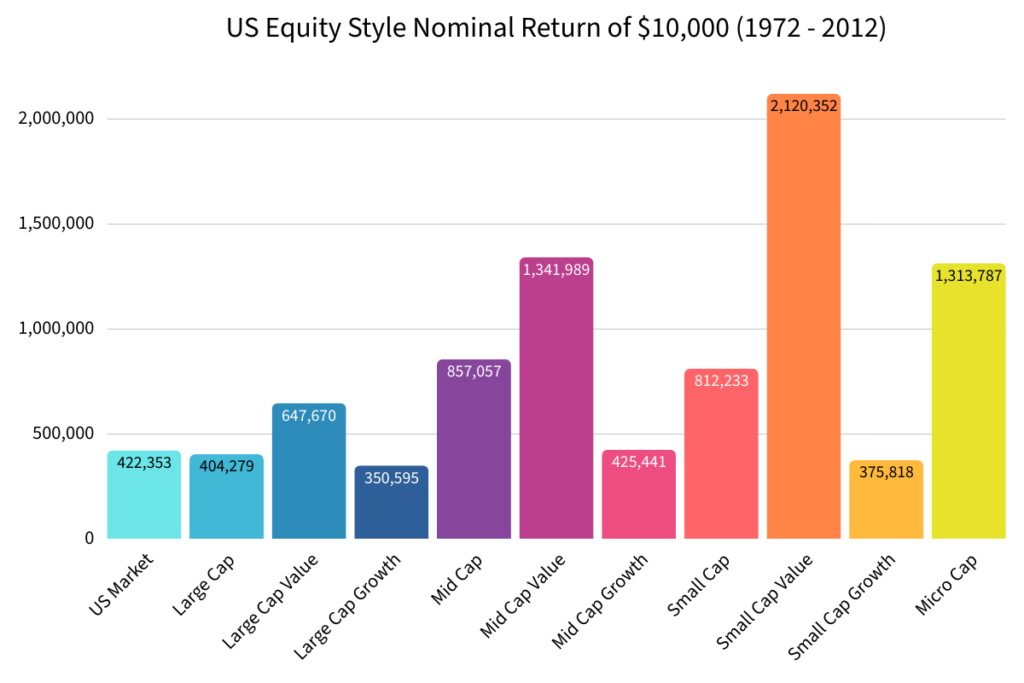
As mentioned above, Small Cap Value had the best CAGR at 14.33%.
If you invested $10,000 in Small Cap Value at an interest rate of 14.33% for 40 years, you would have ended up with $2,120,352!
**It’s important to note that this is all based on synthetic Fama and French data. There wasn’t a way for the average person to invest in Small Cap Value in 1972.**
If you invested $10,000 in the US Market over the same period of time, you would have ended with $422,353.
| US Equity Style (1972 – 2012) | CAGR | Nominal Return |
|---|---|---|
| US Market | 9.81% | $422,353 |
| Large Cap | 9.69% | $404,279 |
| Large Cap Value | 10.99% | $647,670 |
| Large Cap Growth | 9.30% | $350,595 |
| Mid Cap | 11.77% | $857,057 |
| Mid Cap Value | 13.03% | $1,341,989 |
| Mid Cap Growth | 9.83% | $425,441 |
| Small Cap | 11.62% | $812,233 |
| Small Cap Value | 14.33% | $2,120,352 |
| Small Cap Growth | 9.49% | $375,818 |
| Micro Cap | 12.97% | $1,313,787 |
US Equity Styles CAGR Compared to US Market CAGR (1972 – 2012)
The US Market, which is what most people invest in, had a CAGR of 9.81% from 1972 to 2012.
Let’s see which US Equity Styles outperformed or underperformed the US Market.
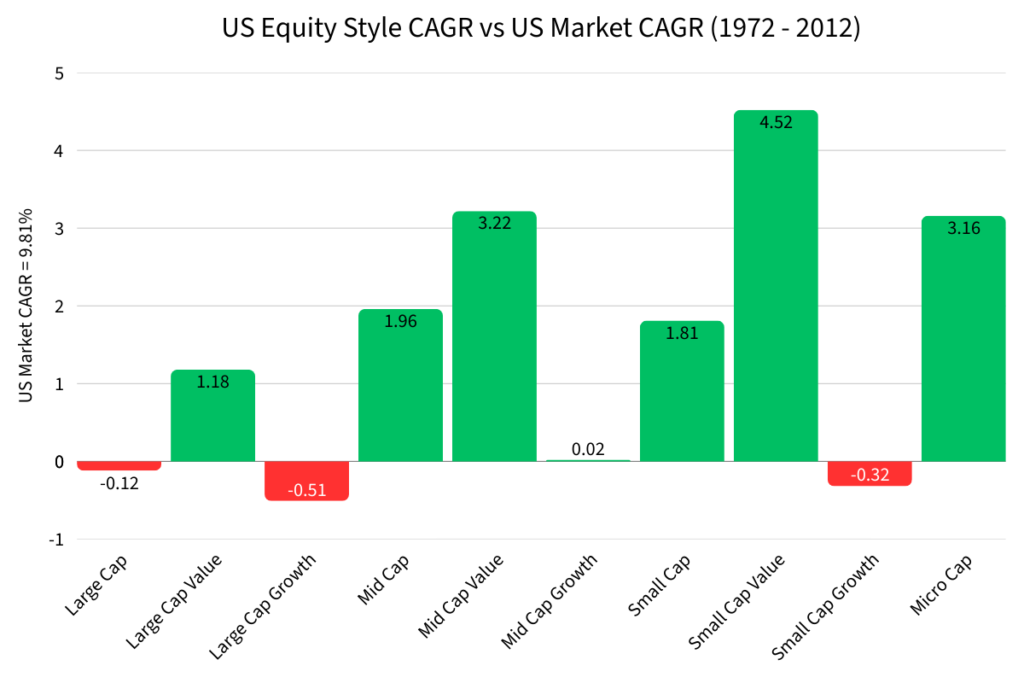
Small Cap Value, Mid Cap Value, Micro Cap, Mid Cap, Small Cap, Large Cap Value, and Mid Cap Growth all outperformed the US Market.
Large Cap Growth, Small Cap Growth, and Large Cap all underperformed the US Market.
| Equity Style | CAGR Outperformance vs. US Market (1972 – 2012) |
|---|---|
| Large Cap | -.12% |
| Large Cap Value | 1.18% |
| Large Cap Growth | -.51% |
| Mid Cap | 1.96% |
| Mid Cap Value | 3.22% |
| Mid Cap Growth | .02% |
| Small Cap | 1.81% |
| Small Cap Value | 4.52% |
| Small Cap Growth | -.32% |
| Micro Cap | 3.16% |
US Equity Style CAGR Compared to CPI CAGR (1972 – 2012)
In 1972, the CPI had a value of 42.5.
In 2012, the CPI had a value of 231.2.
The CAGR of the CPI from 1972 to 2012 was 4.33%. This means on average, the cost of living increased by 4.33% every year for 40 years.
Let’s see how each US Equity Style performed against the CPI CAGR of 4.33%.
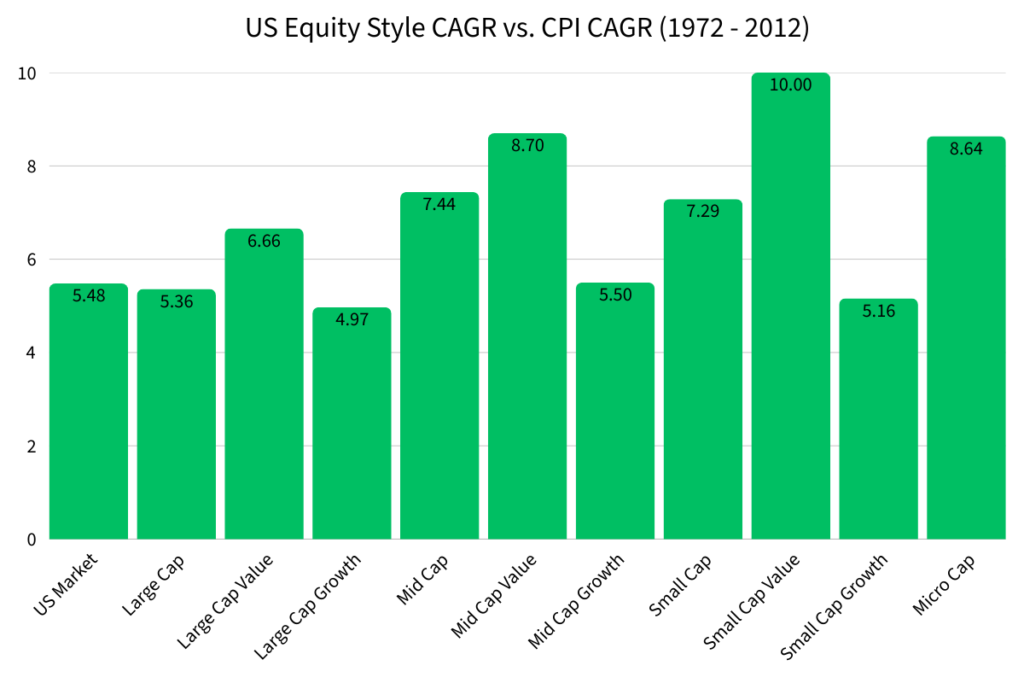
Fortunately, all US equity styles outperformed CPI. This is a bare minimum for investors because you want your money to compound at a higher rate than the increases in the costs of living.
| US Equity Style | CAGR Outperformance vs. CPI (1972 – 2012) |
|---|---|
| US Market | 5.48% |
| Large Cap | 5.36% |
| Large Cap Value | 6.66% |
| Large Cap Growth | 4.97% |
| Mid Cap | 7.44% |
| Mid Cap Value | 8.70% |
| Mid Cap Growth | 5.50% |
| Small Cap | 7.29% |
| Small Cap Value | 10.00% |
| Small Cap Growth | 5.16% |
| Micro Cap | 8.64% |
US Equity Style CAGR Compared to M2 Money Supply CAGR (1972 – 2012)
Now we need to compare US Equity Styles to the M2 Money Supply.
In 1972, the M2 Money Supply was $.8023 trillion.
In 2012, the M2 Money Supply was $10.46 trillion.
The CAGR of the M2 Money Supply from 1972 to 2012 was 6.63%. This means on average, the US dollar was debased or diluted by 6.63% each year for 40 years.
Let’s see how each US Equity Style performed against the M2 Money Supply CAGR of 6.63%.
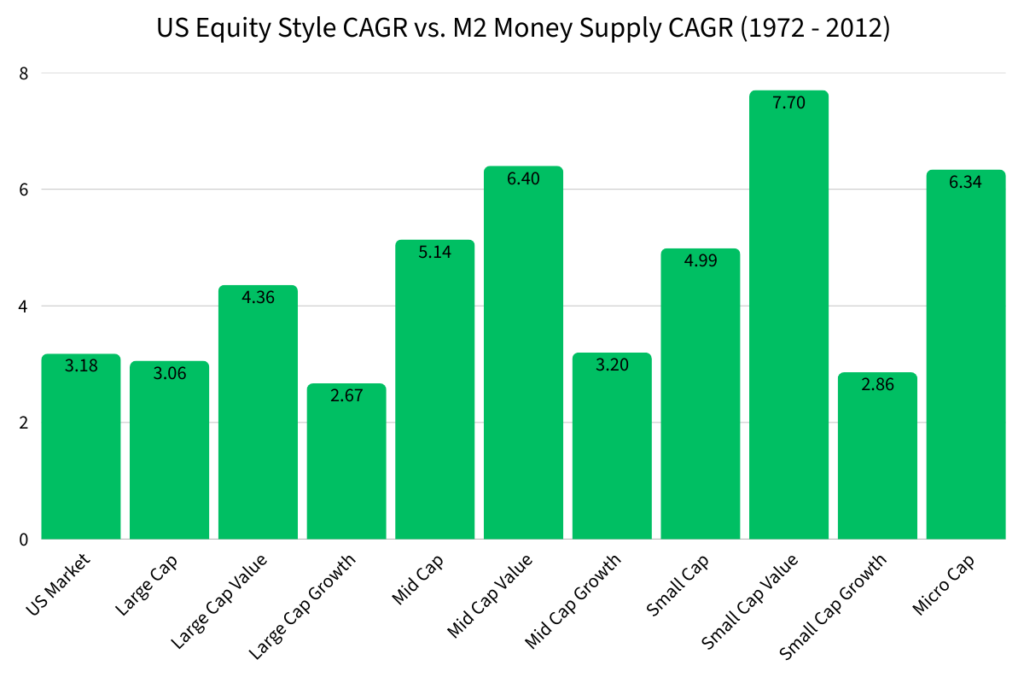
Each US equity style outperformed the M2 Money Supply during the period of 1972 to 2012. US equities compounded at a rate greater than the debasement of the dollar. Investors were able to generate real wealth during this period of time.
| US Equity Style | CAGR Outperformance vs. M2 Money Supply (1972 – 2012) |
|---|---|
| US Market | 3.18% |
| Large Cap | 3.06% |
| Large Cap Value | 4.36% |
| Large Cap Growth | 2.67% |
| Mid Cap | 5.14% |
| Mid Cap Value | 6.40% |
| Mid Cap Growth | 3.20% |
| Small Cap | 4.99% |
| Small Cap Value | 7.70% |
| Small Cap Growth | 2.86% |
| Micro Cap | 6.34% |
What This Period Teaches Us About US Equity Style Returns
From 1972 to 2012, US equity investors operated in a fundamentally different monetary and fiscal environment than the one we are in today. The end of the gold standard allowed persistent deficit spending, monetary expansion, and rising leverage — but those forces had not yet fully constrained policy by 2012.
During this period, smaller and cheaper equity styles consistently delivered superior long-term returns. Small Cap Value, Mid Cap Value, and Micro Cap equities not only produced the highest nominal CAGRs, but also provided the greatest protection against inflation and monetary dilution. This suggests that ownership of productive, undervalued businesses was especially powerful in an era where capital formation was still relatively unconstrained.
In contrast, Large Cap Growth underperformed for most of this period. High interest rates, stricter antitrust enforcement, and less financialization made it difficult for large, expensive companies to dominate returns the way they have in more recent years.
The most important takeaway, however, is not which equity styles performed best — it is why they did. These results occurred before US debt-to-GDP surpassed 100%, before fiscal dominance became unavoidable, and before monetary policy became structurally dependent on suppressing interest rates.
This raises a critical question for investors going forward: if US equity styles behaved one way before the debt constraint became binding, should we expect the same relationships to hold after it did?
My answer is no.