Why Your Paycheck Isn’t Keeping Up (And It’s Not Your Fault)
You’re doing everything you were told to do growing up. You got a good job and worked your way up the corporate ladder. You save what you can. But no matter what you do, it feels like you are always one step behind.
Your paycheck goes up but somehow things never get easier. Rent, groceries, and everything else you need to survive goes up in price year after year.
Here is the thing. You are not bad with money. You are not lazy.
The data shows that the average American worker has barely gained any real purchasing power since 1972. In this article, I will show you exactly what that means, why it happened, and why almost nobody is talking about it honestly.
TL;DR – Key Takeaways
Since 1972 wages grew 648% but inflation grew 683%. Inflation won.
In real purchasing power terms the average worker earns $0.80 less per hour today than in 1972.
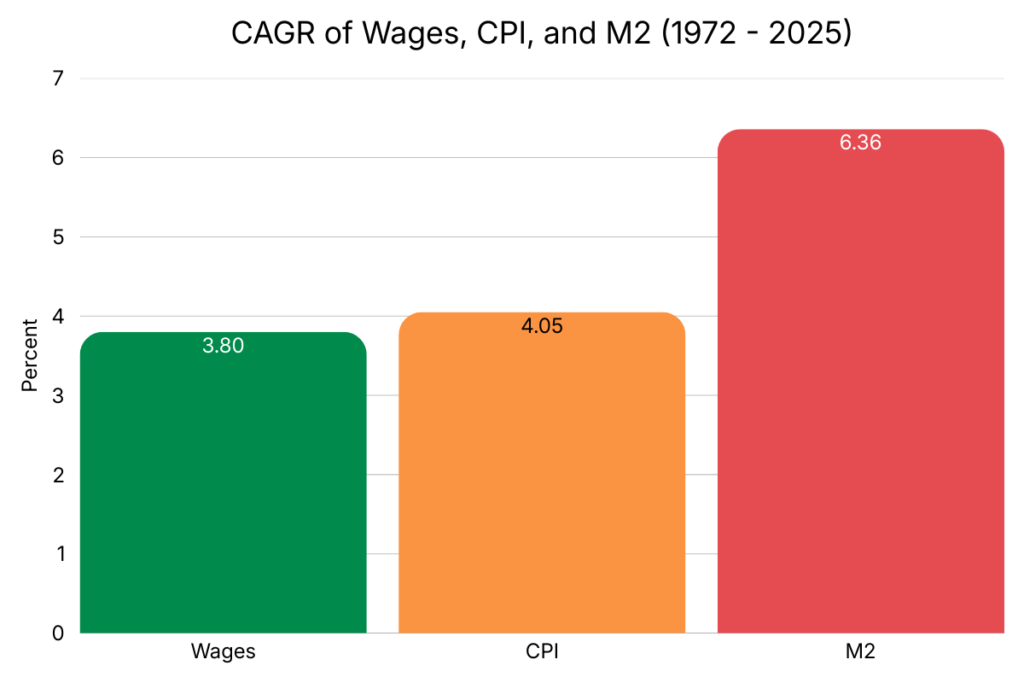
Wages grew at 3.80% per year. Inflation grew at 4.05% per year. The money supply grew at 6.36% per year.
Debt and money supply grew under every president since 1972 regardless of party.
Understanding why your paycheck feels like it never goes far enough is the first step to seeing the economy clearly.
- TL;DR – Key Takeaways
- First, Let's Go Back to 1971
- The Numbers Don't Lie
- Why Hasn't Anyone Fixed This?
- So What Does This Mean for You Personally?
- The Bottom Line
- Frequently Asked Questions
- Why have wages not kept up with inflation since 1972?
- What is the difference between a real wage and a nominal wage?
- What happened to the purchasing power of the dollar after the gold standard ended?
- Was there ever a period when workers actually came out ahead?
- Is this a political problem that the right president could fix?
First, Let’s Go Back to 1971
To understand what is happening to your paycheck today, you have to understand something that happened over 50 years ago. Something that I don’t remember learning about in school.
In 1971, President Nixon made a decision that changed the entire financial system. He ended the gold standard.
What Was the Gold Standard?
Before 1971, every US dollar in existence was tied to a fixed amount of gold. The government could only print as many dollars as it had gold to back them up. It was a hard limit on the amount of money in the financial system.
This kept the money supply (the total amount of dollars in circulation) under control. It also kept inflation relatively low over long periods of time because you simply could not create money out of thin air.
What Happened When We Left the Gold Standard
When Nixon cut the tie to gold the US dollar became what is called a fiat currency. The dollar is now valuable because the government says it is. It’s not backed by anything physical.
That meant that the US government could create money out of thin air. Any time there was a crisis, a recession, a war, or a political need to spend money, the answer became printing more of it.
And that is exactly what happened. Over the next 50 years the US money supply (called M2) grew from $0.80 trillion in 1972 to over $22 trillion in 2025. That is an increase of over 2,600%.
Here is the important question nobody asks enough.
If we created that much new money, where did it all go? And why does the average worker have almost nothing to show for it?
The Numbers Don’t Lie
Let’s look at the actual data.
Wages vs Inflation: The Core Problem
In 1972 the average hourly wage in the United States was $4.25.
By 2025 it had grown to $31.80.
That is a 648% increase over 53 years. Sounds great on paper.
But over that same period the Consumer Price Index (the CPI, which is the government’s way of measuring how much everyday things cost) went from 42.5 to 332.6.
That is a 683% increase.
Inflation outperformed wages. Steadily, year after year for over 50 years, the cost of living grew faster than the paycheck.
That gap is why you feel squeezed even when your income goes up.
Nominal Wages vs Real Wages: The Difference That Changes Everything
There are two ways to look at your wage.
Your nominal wage is the dollar amount on your paycheck. It is the number your boss gives you. The number that goes up when you get a raise.
Your real wage is what that dollar amount can actually buy. It accounts for inflation. It tells you the truth about whether you are actually getting ahead.
Here is a simple example. Say you make $20 an hour this year. Next year your boss gives you a 5% raise and you now make $21 an hour. That feels good. But if inflation that year was also 5%, everything you buy (groceries, gas, rent, utilities) also went up 5%. Your paycheck went up but so did everything else. Your real wage did not move at all.
That is the treadmill. More dollars, same purchasing power. You are running but you are not going anywhere.
So What Does 50 Years of Real Wages Look Like?
When you adjust wages for inflation across the entire 1972 to 2025 period the picture is pretty shocking.
In 1972 the average hourly wage in today’s dollars was worth about $32.60.
In 2025 that same calculation gives you about $31.80.
After 53 years the average American worker’s purchasing power per hour is essentially the same as it was in 1972.
Think about what happened in those 53 years. The US economy grew from roughly $1.2 trillion to over $27 trillion. We went through two technological revolutions. Worker productivity went up significantly. Corporate profits hit all time highs.
Yet the average hourly worker ended up right back where they started in terms of what their paycheck can actually buy.
That is not an accident. And it is not your fault.
Why Hasn’t Anyone Fixed This?
If wages have been losing to inflation for 50 years, why hasn’t the government done something about it?
The honest answer is uncomfortable. This is not mainly a problem of bad politicians or bad decisions. It is a structural problem. That means it is baked into how the system itself works. And that makes it a lot harder to fix than most people realize.
This Is Not a Democrat or Republican Problem
One of the most important things the data shows is what happens when you look at it by presidential administration.
Government debt (which is directly tied to money printing and inflation) went up under every single president since 1972. Every one. Republican and Democrat alike.
Nixon. Ford. Carter. Reagan. Bush. Clinton. Bush. Obama. Trump. Biden. The party in charge changes. The promises change. The direction of the debt does not.
This is not about blaming one party or defending another. It is about understanding the incentives that every politician faces regardless of their beliefs. When you need to get reelected every few years it is almost always easier to spend money and borrow than to raise taxes or cut programs. The consequences of that borrowing show up years or decades later, often when someone else is in office. So the pattern just keeps repeating.
The System Was Built This Way After 1971
Before 1971 there was a hard limit on all of this. You could not print more money than you had gold. That rule was not perfect but it prevented one specific thing (unlimited money creation whenever it was convenient).
Once that limit was removed every crisis became an excuse to create more money. The savings and loan crisis in the 1980s. The dot com crash. The 2008 financial crisis. COVID. Each time the response included significant money creation. Each round of money creation diluted the value of every dollar already in existence. And each time that dilution hurt the people whose wealth was in wages and savings more than the people whose wealth was in assets.
So What Does This Mean for You Personally?
Let’s bring this down from the macro level to something you can actually feel.
Buying a Home Used to Be More Achievable
In 1972 the median home price in the US was about $29,200. At the average wage of $4.25 per hour that was roughly 3.3 years of full time gross pay to cover the price of a home.
In 2025 the median home price is about $405,000. At the average wage of $31.80 per hour that is roughly 6.1 years of full time gross pay.
The amount of work required to buy a home has nearly doubled in one lifetime. And that is before factoring in that mortgage rates are now above 6.5% after sitting near 3% just a few years ago. The monthly payment on a median priced home today eats up a much larger share of the average paycheck than at almost any point in the last 50 years.
Homeownership used to be the main way regular people built wealth without needing a finance degree. That path has not disappeared but the first step has gotten a lot harder to reach for a lot of people.
Each Generation Starts the Race Further Back
There is a generational angle to this that does not get talked about honestly enough.
Someone who finished college in 1972 started their adult life at year zero of this whole cycle. Home prices had not yet reflected 50 years of money printing. The national debt was about 35% of the size of the entire US economy. The consequences of leaving the gold standard had not piled up yet. That person got to ride the whole wave. They bought a house before decades of price appreciation. They invested before a 40 year bull market. They built wealth during conditions that were genuinely favorable in ways that are hard to replicate today.
Someone starting out in 2025 inherits the accumulated weight of all of it. Home prices already reflect 50 years of monetary expansion. The national debt is $38.5 trillion. The tailwinds that made conventional financial advice work so well for previous generations were products of a specific historical era. That era may not repeat.
This is not about one generation being lazy and another being hard working. The starting conditions are genuinely and measurably different. The data shows it clearly.
The Bottom Line
Here is what 50 years of data actually tells us.
Wages grew 648% since 1972. Inflation grew 683%. After more than half a century the average American worker has roughly the same purchasing power per hour as they did when Nixon ended the gold standard.
The economy grew enormously during that time. Corporations got bigger and more profitable. Asset prices exploded. Wealth was created on a massive scale. It just did not flow to the average worker’s paycheck in any meaningful way.
That is not a personal failure. It is not a sign that you need to work harder or budget better. It is what happens when a system runs this way for long enough.
Understanding this matters because it changes how you see things. It changes how you think about the financial advice you have been given. In a separate post I explored how I view my own investments (New Ways to Think About Investing in a High Debt High Inflation World).
It changes how you think about the news you hear. And it helps explain the gap between what you were told hard work would produce and what it actually has.
The feeling that something is not working even when you are doing everything right is not a personal failing. The data says it is an accurate read of the situation.
Frequently Asked Questions
Why have wages not kept up with inflation since 1972?
Since the US left the gold standard in 1971 the money supply has grown from about $0.80 trillion to over $22 trillion. All that new money pushed up the price of goods, services, and assets faster than wages grew. The result is that paychecks look bigger in dollar terms but buy roughly the same amount as they did 50 years ago, or in some cases less.
What is the difference between a real wage and a nominal wage?
Your nominal wage is the dollar amount on your paycheck. Your real wage is what those dollars can actually buy after accounting for inflation. If your pay goes up 5% but prices also go up 5% your real wage has not changed. You have more dollars but each one buys the same amount as before.
What happened to the purchasing power of the dollar after the gold standard ended?
In the five decades since the US left the gold standard the purchasing power of the dollar has dropped by about 87%. Wages have gone up in dollar terms but have not kept pace with that loss of purchasing power for the average worker.
Was there ever a period when workers actually came out ahead?
Yes. The 1990s stand out clearly in the data as the one sustained decade where real wages meaningfully improved for average workers. Low inflation, rising productivity, and relatively controlled money creation combined to produce real gains in purchasing power. It remains the exception in the post-1972 data, not the rule.
Is this a political problem that the right president could fix?
The data suggests it is more structural than political. Government debt and money supply growth increased under every president since 1972 regardless of party. The incentives built into the system make it very difficult for any individual politician to change the long term trajectory even if they wanted to. Understanding it as a structural issue rather than a political one is one of the more important shifts in how you think about the economy.