America’s Tab: How the National Debt Grew and Who Actually Pays For It
What if the national debt isn’t really a problem the government is trying to solve, but a feature of the system itself?
Most Americans think about the national debt the way they think about personal debt. If you borrow too much and you don’t pay it back, then you’re in trouble. This way of thinking makes sense for a household. However, it doesn’t quite work like that for a government that controls its own currency, sets its own interest rates, and has the entire world using its money.
Although the US can borrow in ways a household never could, someone still pays. Most often it is paid through inflation that quietly erodes your purchasing power, through interest rates that make your mortgage more expensive, and through taxes that have to keep growing just to service the debt that doesn’t stop compounding.
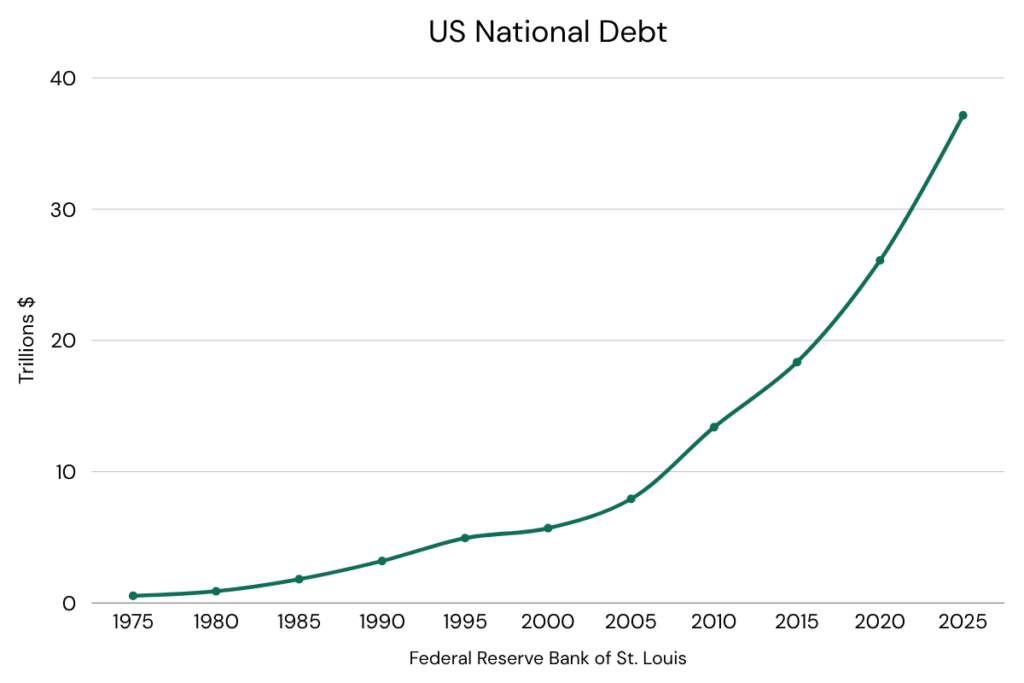
The national debt just crossed $39 trillion. It’s growing faster than the economy. The government is now borrowing money just to pay the interest on money it already borrowed. And the system that we all live in was designed to require constant inflation just to function.
This article breaks down how we got here, who’s actually holding the tab, and what the math says about where this goes if nothing changes.
TL;DR – Key Takeaways
The U.S. national debt didn’t just happen. It’s the result of decades of political choices, a fundamental shift in how money works, and a system built around constant borrowing.
Since the U.S. left the gold standard in 1971, the dollar has been backed by nothing but trust. That change made it easier to spend without collecting enough in taxes to cover the bill.
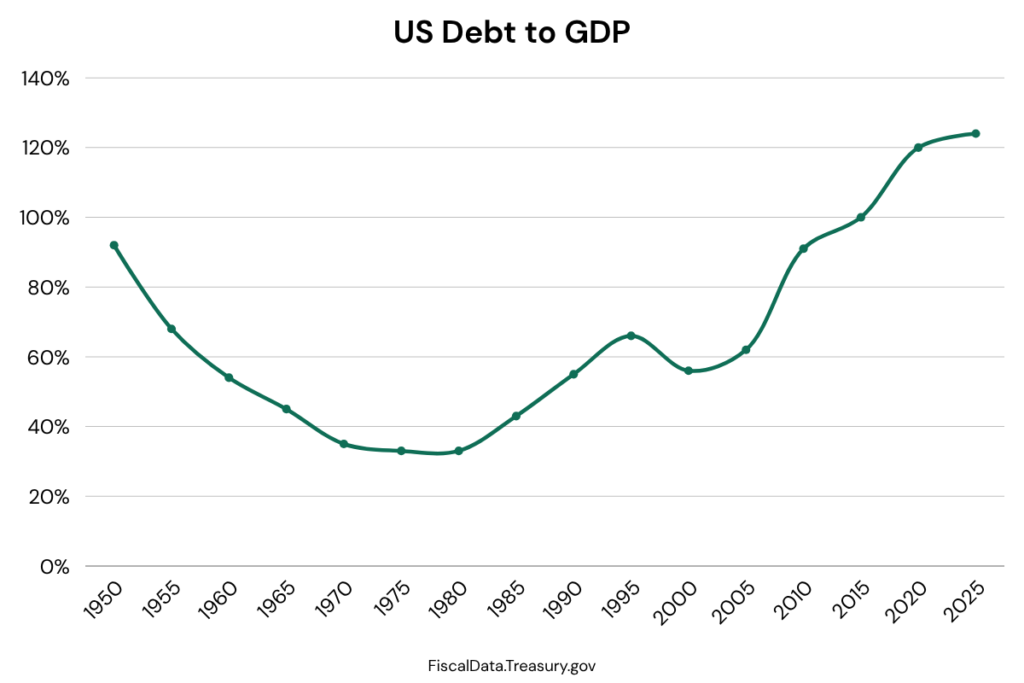
Today, the debt exceeds 120% of GDP. The government now borrows money just to pay the interest on money it already borrowed. Regular Americans pay for this through higher prices, higher taxes, and a slower economy.
- TL;DR – Key Takeaways
- What Is the National Debt?
- The Gold Standard Era and Why It Ended
- The Fiat Era and the New Rules of Money
- The Revenue vs. Spending Problem
- How the Government Actually Borrows Money
- Who Holds the Debt Right Now?
- Debt to GDP at 120%+ and Why That Changes Everything
- The Reserve Currency Advantage and Its Limits
- What Happens If This Continues?
- Frequently Asked Questions
- Who does the U.S. owe the national debt to?
- Can the government just print money to pay off the debt?
- Why does the debt keep growing even when the economy is doing well?
- What's the difference between the debt and the deficit?
- Is the national debt actually a problem if we owe it to ourselves?
- What would happen if the U.S. defaulted on its debt?
What Is the National Debt?
The national debt is the total amount of money the federal government owes to its creditors. Every time the government spends more than it collects in taxes (called a deficit), it has to borrow the difference. That borrowing stacks up year after year. The national debt is the running total of all those deficits going back decades.
Think of it like a credit card balance. You can run a small balance for a while and manage the minimum payments. But if the balance keeps growing faster than your income, the payments eventually become the problem.
As of Q4 2025, the U.S. national debt has crossed $39 trillion. That’s roughly $114,000 for every person living in the United States.
Two terms to know before we go further:
- Deficit: The annual gap between what the government spends and what it collects. If the government spends $6 trillion and collects $4.5 trillion, the deficit is $1.5 trillion for that year.
- Debt: The accumulated total of all deficits over time, minus any surpluses.
The debt doesn’t just sit there, the government pays interest on it like you pay interest on a loan. But now that interest payment is one of the biggest line items in the entire federal budget.
The Gold Standard Era and Why It Ended
To understand how the debt got this big, you have to go back to 1971. That’s the year our current economic system was created.
Before 1971, the U.S. dollar was tied to gold. Under the Bretton Woods agreement (established after World War II), the dollar was convertible to gold at a fixed rate of $35 per ounce. Other countries pegged their currencies to the dollar. This created a global monetary system anchored to something physical and finite.
That system had a built-in brake on spending. If the government printed too many dollars, other countries could demand gold in exchange. That limited how much the government could borrow and spend without real consequences.
Nixon Closes the Gold Window
On August 15, 1971, President Nixon announced that the U.S. would no longer convert dollars to gold. This became known as the Nixon Shock. It wasn’t a minor policy adjustment. It was a fundamental change in what money is.
Why did he do it? The U.S. had been running large deficits to fund the Vietnam War and domestic spending programs. Foreign governments (especially France) were starting to demand gold in exchange for their dollars. The U.S. was running low on gold reserves. Nixon ended convertibility to stop the bleeding.
The move was supposed to be temporary. It wasn’t. From that point forward, the U.S. dollar became what’s called a fiat currency. It’s not backed by gold or any physical commodity. It’s backed by trust, government decree, and the full faith and credit of the United States.
There is an argument to be made that the dollar is backed by oil, but that’s a topic that requires its own deep dive.
The Fiat Era and the New Rules of Money
Once the dollar became a fiat currency, the rules changed. The government could, in theory, create as much money as it needed. There was no more worry about having to have enough gold in reserves anymore.
This created a new dynamic that shapes everything that follows:
- A fiat monetary system requires ongoing inflation to function. Debt gets easier to repay when the currency is worth a little less each year.
- The money supply (measured as M2) has grown at roughly 6% per year on average over the past several decades. That’s not an accident. It’s a feature of how the system works.
- Constant money supply growth means constant upward pressure on prices. That’s inflation.
Here’s where it can get uncomfortable if you really think about how the system works.
If the system requires inflation to function, government revenue also needs to keep up with inflation. Otherwise, it collects less and less in real terms each year. That means taxes should theoretically rise with inflation, or wages need to rise so that tax receipts grow naturally.
But here’s the problem. Consumers are getting hit by that same inflation on their end. Rent, groceries, and gasoline all go up in price year after year. So at the exact moment the system needs more revenue, the regular people providing that revenue through taxes are the ones struggling the most.
The result is a structural squeeze.
Inflation is a requirement for the economic system to function. Therefore consumer prices must always rise. Politicians will never raise taxes when inflation is high because they wouldn’t get reelected. So instead the government borrows more and more, and the debt burden increases.
The Revenue vs. Spending Problem
Now think of it from a political point of view. Every politician wants to cut taxes. Spending more on social programs can also be popular depending on what side of the aisle you’re on. But cutting taxes AND increasing spending at the same time (which has happened significantly over the past 50 years) is guaranteed to increase the debt.
Here’s how the debt grew through each major era:
| Era | Key Driver(s) | Approx. Debt at End of Period |
|---|---|---|
| Pre-1971 (Gold Standard) | WWII spending, Cold War defense | ~$400 billion |
| Nixon to Carter (1971–1980) | Vietnam, stagflation, oil shocks | ~$900 billion |
| Reagan Era (1981–1988) | Tax cuts, defense spending, Cold War | ~$3 trillion |
| Bush Sr. / Clinton (1989–2000) | Gulf War, recession, dot-com bubble | ~$5.7 trillion |
| Bush Jr. Era (2001–2008) | Tax cuts, two wars, Medicare Part D | ~$10 trillion |
| Obama Era (2009–2016) | Financial crisis response, ACA | ~$20 trillion |
| Trump Era (2017–2020) | Tax Cuts & Jobs Act, COVID stimulus | ~$28 trillion |
| Biden Era (2021–2024) | COVID recovery, infrastructure, inflation | ~$34 trillion |
| Trump Era (2025-Present) | Big Beautiful Bill, interest on debt, defense | ~$39 trillion |
A few eras worth highlighting:
The Reagan Era (1981 to 1989)
Reagan cut taxes dramatically with the Economic Recovery Tax Act of 1981 while also increasing defense spending significantly. The national debt nearly tripled during his two terms, going from roughly $994 billion to $2.9 trillion. This was the first era where the structural deficit became a permanent feature rather than a temporary condition.
Post-9/11 and the 2000s
The early 2000s brought two major tax cuts alongside two wars and the creation of a large new entitlement program (Medicare Part D). By 2008, before the financial crisis even hit, the debt was around $10 trillion.
COVID-19 (2020 to 2021)
The pandemic triggered the largest peacetime spending surge in U.S. history. Stimulus checks, expanded unemployment benefits, PPP loans, and enhanced healthcare spending added several trillion dollars in a matter of months.
The pattern is consistent across parties and presidents.
Spending goes up in a crisis and rarely comes back down. Tax cuts get passed during good times and are rarely increased. Raising taxes while people are already struggling to make ends meat is a sure fire way to not be re-elected.
How the Government Actually Borrows Money
Most people assume the government just prints money when it needs it. The reality is more complicated and more important to understand.
When the federal government needs to borrow, it does it through the Treasury Department. Treasury issues securities (essentially IOUs) to investors. Those investors lend the government money today in exchange for regular interest payments and repayment of the full amount later.
The Types of Treasury Securities
- T-Bills (Treasury Bills): Short-term debt, maturing in 4 weeks to 1 year. Used for near-term cash needs.
- T-Notes (Treasury Notes): Medium-term debt, maturing in 2 to 10 years. The most commonly issued type.
- T-Bonds (Treasury Bonds): Long-term debt, maturing in 20 to 30 years.
- TIPS (Treasury Inflation-Protected Securities): Principal adjusts with inflation. Popular with investors worried about purchasing power erosion.
The Auction Process
Treasury securities are sold through auctions. Primary dealers (large financial institutions like JPMorgan and Goldman Sachs) are required to participate in every auction. They buy Treasury securities and then sell them to clients or hold them on their own books.
The key variable is the yield, which is the interest rate the government pays. If demand (how many people are buying them) for Treasuries is strong, yields stay low and the government borrows cheaply. If demand is weak, yields rise to attract buyers. Higher yields mean higher interest payments on the entire debt load.
The Federal Reserve’s Role
The Federal Reserve isn’t the same as the Treasury. The Treasury borrows the money. The Fed is an independent central bank that sets interest rate policy and controls the money supply.
However, the Federal Reserve does buy Treasury securities, particularly during crises. This is called quantitative easing (QE). When the Fed buys Treasuries, it creates new money and uses it to purchase government debt. This keeps yields low and provides the government with a buyer when private demand falls short.
This is what happened during the Great Financial Crisis in 2008 and the Covid Pandemic in 2020.
But there’s a catch.
When the Fed buys debt by creating new money, it expands the money supply. That’s inflationary. So the Fed’s role as buyer of last resort for government debt is directly connected to the inflation that shows up in your grocery bill.
Who Holds the Debt Right Now?
Not all of the national debt is owed to the same people. It breaks down into four main categories, and who holds the debt matters a lot for what happens next.
| Holder | Approx. Share | Key Notes |
|---|---|---|
| Intragovernmental (Social Security, etc.) | ~20–25% | Government owes it to its own trust funds |
| Federal Reserve | ~15–20% | Built up via QE; slowly reducing via QT |
| Foreign Governments & Investors | ~25–30% | Japan & China largest; China reducing holdings |
| Domestic Investors (banks, pensions, funds) | ~25–30% | Held as ‘safe’ reserve asset |
Intragovernmental Holdings (roughly 20 to 25%)
This is money the government owes to itself. The Social Security Trust Fund, for example, takes in payroll taxes and invests the surplus in Treasury securities. This portion of the debt is real but it’s technically owed to other government programs, not outside investors.
The Federal Reserve (roughly 15 to 20%)
Through its quantitative easing programs in 2008 to 2009 and again in 2020 to 2021, the Fed accumulated a massive portfolio of Treasuries. It has been slowly reducing those holdings through quantitative tightening (QT), but it remains one of the largest single holders of U.S. debt.
Foreign Governments and Investors (roughly 25 to 30%)
Japan and China have historically been the two largest foreign holders. However, China has been steadily reducing its Treasury holdings (especially when the US hit over 100% debt to GDP). The trend of declining foreign demand is important to watch because it could have an effect on yields.
Domestic Investors (roughly 25 to 30%)
U.S. banks, pension funds, insurance companies, mutual funds, and individual investors hold Treasuries as a safe, liquid asset. However, it all depends on what yields investors are willing to accept, especially in a high debt to GDP world.
Debt to GDP at 120%+ and Why That Changes Everything
For most of U.S. history, the national debt was a fraction of the size of the economy. After World War II, the debt-to-GDP ratio peaked around 106% and then steadily declined as the economy grew. By the 1970s, it was around 30%. For decades, it looked manageable.
Today, the debt-to-GDP ratio is above 120%. That means the total debt is larger than the entire annual economic output of the United States. At that level, the math starts working against you in a serious way.
The Buyer Incentive Problem
If you’re a sophisticated investor considering buying U.S. Treasuries, you have to think about your real return. M2 money supply has grown at roughly 6% per year on average. That’s the rate at which the purchasing power of your dollars is being diluted over time.
So if you’re buying a 10-year Treasury bond yielding 4.5%, you’re losing purchasing power in real terms. You’re not increasing your wealth. You’d need at least a 6% yield just to break even against monetary debasement.
Rational investors should demand higher yields to compensate for this. But higher yields make the debt more expensive to service. Which worsens the fiscal situation. Which should push yields higher still. That’s the feedback loop that keeps debt economists up at night.
Borrowing to Pay Interest
Here’s the part that isn’t talked about on the news or CNBC. The U.S. government is now in a position where it has to borrow new money just to pay the interest on the money it already borrowed.
| Federal Budget Item | Approx. Cost (FY2025) |
|---|---|
| Medicare | $997 billion |
| Interest | $962 billion |
| National Defense | $919 billion |
| Medicaid & CHIPS | $692 billion |
| Veteran Support | $375 billion |
The government isn’t running a surplus to cover those interest payments. It’s adding them to the debt. That’s not debt management. That’s a debt spiral by definition.
The Reserve Currency Advantage and Its Limits
So why hasn’t this blown up already? If the math is this bad, why is the U.S. still able to borrow at relatively reasonable rates?
The answer is reserve currency status.
What Reserve Currency Status Actually Means
The U.S. dollar is the world’s reserve currency. Most global trade (especially oil) is priced and settled in dollars. Central banks around the world hold dollars as their primary reserve asset. Countries need dollars to participate in the global economy.
For example, Japan imports a lot of their oil because they are an island. If they want to purchase oil, they need to convert their currency (Japanese Yen) into dollars to use to purchase the oil. But they also need to have enough US dollars in their bank to be able to do the currency conversion.
This creates a structural demand for dollar assets. Countries park their dollars into US Treasuries because they are safe and liquid.
This is sometimes called the exorbitant privilege — a term coined by French Finance Minister Valéry Giscard d’Estaing in the 1960s as a criticism of American monetary dominance.
Why It’s Different From Japan
Japan’s debt-to-GDP ratio exceeds 260%, which is the highest in the developed world. However, Japan borrows in its own currency and has a domestic savings culture that supports high internal demand for government bonds. But, Japan’s central bank has become the buyer of last resort, essentially trapping it in a cycle of monetizing debt to keep rates manageable. Growth has been stagnant for decades.
Reserve currency status is what separates the U.S. from the Japanese example.
The Slow Erosion of Dollar Dominance
- China and Russia have been settling bilateral trade outside the dollar system.
- BRICS nations have been discussing alternative reserve arrangements.
- Central banks globally have been quietly increasing gold reserves and reducing the dollar share of their foreign exchange holdings.
- Saudi Arabia has floated accepting non-dollar payment for oil (potentially a game changer because the petrodollar system has been supporting US Treasuries for 50 years).
This doesn’t mean that the dollar is going to lose its reserve status tomorrow. But it does represent a slow erosion of the structural demand for US Treasuries that has allowed the US to borrow cheaply for decades. And this erosion is happening when the US needs that demand even more.
What Happens If This Continues?
This isn’t a prediction of what’s going to happen in the future, but potential outcomes if the current trajectory holds. Some of these outcomes are already starting to show up.
Interest Crowding Out Everything Else
Net interest on the national debt is already almost $1 trillion per year. Every dollar going to interest is a dollar not available for infrastructure, education, healthcare, or defense. This doesn’t require a crisis to be damaging. It’s already happening quietly, compounding every year.
Inflation as the Default Policy Tool
When borrowing becomes too expensive and raising taxes is politically impossible, the path of least resistance is inflation. Allow the money supply to grow, let prices rise, and the real value of the debt shrinks over time. It’s sometimes called a soft default.
Inflation functions as a tax, and it’s the most regressive one there is. It hits regular Americans hardest because they spend most of their income on necessities (food, rent, energy) rather than assets that appreciate with inflation. Wealthy households own stocks and real estate that tend to rise with inflation. Wage earners just watch their purchasing power erode.
Dollar Reserve Status Erosion
A gradual decline in foreign demand for Treasuries would force yields higher to attract buyers. Higher yields mean higher borrowing costs for the government and for consumers. Mortgages, car loans, and credit cards are all tied to interest rate levels. This is a slow process, not a sudden collapse.
The Austerity Trap
If the government tried to address the debt through serious spending cuts or tax increases, the short-term effect would likely be slower economic growth. Slower growth means less tax revenue. Less revenue widens the deficit even more. There’s no clean exit. Every serious option involves someone absorbing a real loss. The question is who bears it.
The Generational Burden
Younger Americans are inheriting a situation they had no hand in creating. They’ll face higher taxes to service a debt that funded spending that primarily benefited previous generations. They’ll deal with higher inflation. Plus, they’re entering the economy without the same asset appreciation tailwinds that helped older generations build wealth. They are starting further behind than previous generations.
This connects to broader trends in wealth inequality and economic mobility that deserve their own full treatment.
Frequently Asked Questions
Who does the U.S. owe the national debt to?
The debt is spread across several groups: foreign governments and investors (roughly 25 to 30%), domestic investors like banks and pension funds (roughly 25 to 30%), the Federal Reserve (roughly 15 to 20%), and other government accounts like the Social Security Trust Fund (roughly 20 to 25%).
Can the government just print money to pay off the debt?
Technically, the government can create money. But printing money to pay off debt would cause massive inflation. If investors saw the U.S. inflating away its debt, they’d demand much higher interest rates on new borrowing to compensate. Reserve currency status depends on the world trusting that the dollar holds its value. That trust is the real constraint.
Why does the debt keep growing even when the economy is doing well?
Because political incentives favor spending and tax cuts during good times and emergency spending during bad times. There’s no equivalent political reward for running surpluses. The U.S. has only run a surplus in four of the past 50 years (1998 to 2001). Structural deficits are baked into the current system.
What’s the difference between the debt and the deficit?
The deficit is the annual gap between spending and revenue. The debt is the total accumulation of all deficits over time. A deficit adds to the debt every year it occurs.
Is the national debt actually a problem if we owe it to ourselves?
Part of the debt is owed to government accounts like Social Security, but a large portion is owed to foreign investors, domestic financial institutions, and the Fed. Even the intragovernmental portion is a real obligation. If Social Security’s trust fund has to cash in its Treasuries to pay benefits, the government has to find that money somewhere. The ‘we owe it to ourselves’ framing understates the real constraints significantly.
What would happen if the U.S. defaulted on its debt?
A U.S. default would be a global financial catastrophe. Treasury securities are the foundation of global finance. They’re used as collateral, held as reserves by central banks, and treated as the risk-free benchmark that everything else is priced against. A default would shatter confidence in the dollar, spike interest rates globally, and likely trigger a severe recession. This is why the U.S. has never defaulted, even during political debt ceiling standoffs.
Sources and Further Reading:
U.S. Treasury Department (TreasuryDirect.gov) | Congressional Budget Office (CBO) | Federal Reserve Economic Data (FRED) | Bureau of Economic Analysis (BEA) | Office of Management and Budget Historical Tables