A $10,000 investment in SPMO back in 2015 would be worth $45,700 today. The same $10,000 in SPY would only be worth $32,730.
That’s a $13,000 difference!
So is SPMO the better investment? Is momentum investing the secret to outperform the market?
I analyzed the returns of SPMO and compared them to important benchmarks including: SPY, gold, CPI, and the money supply to see how it really performed.
If you liked this piece, be sure to read my other ETF breakdowns. I dig into popular ETFs and benchmark their real returns against CPI, M2, gold, and more.
1. What is SPMO ETF?
SPMO is the Invesco S&P 500 Momentum ETF. It launched in October 2015.
The fund tracks the S&P 500 Momentum Index, a group of roughly 100 stocks pulled from the S&P 500. These are the stocks that have shown the strongest price momentum over the past year.
How often does SPMO rebalance?
Twice a year, in March and September.
Does SPMO include medium or small-cap stocks?
No. It does not include companies in the S&P 400 (mid-caps) or S&P 600 (small-caps). SPMO only holdings companies in the S&P 500.
2. How SPMO’s Momentum Score Actually Works
SPMO doesn’t just buy whatever stock is the hottest at the moment. The index runs a specific formula to determine its holdings.
- It looks at each stock’s price performance over the past 12 months, skipping the most recent month.
- It adjusts that score for volatility. A stock with a smooth, steady climb scores higher than one that spikes and crashes.
- The top 100 stocks by that adjusted score make the index.
Why does market cap matter if this is a momentum fund?
SPMO doesn’t rank stocks by a momentum score alone. It multiplies momentum score by the company’s market capitalization.
That means a massive company with less momentum can out-rank a smaller company with higher momentum.
What sectors does SPMO favor right now?
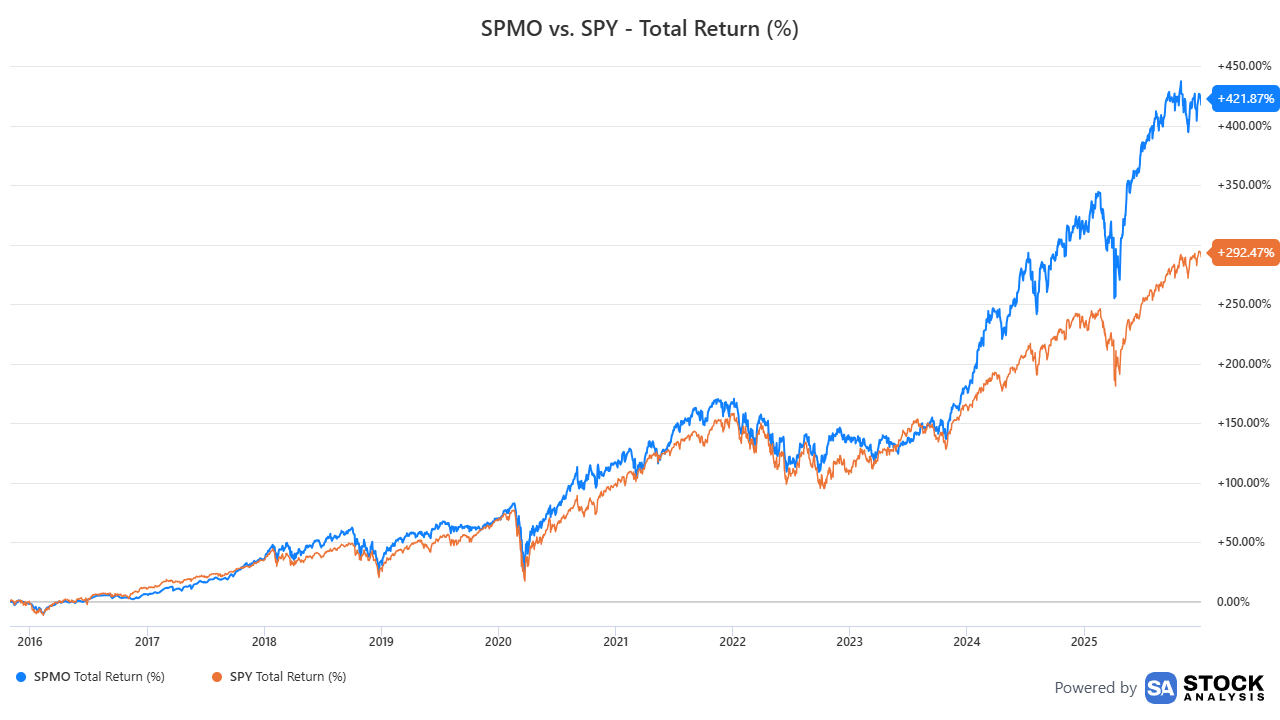
Technology. SPMO currently holds almost 18% more in tech than the S&P 500 does.
SPMO isn’t a true momentum strategy. It’s a strategic, large-cap momentum play that leans hard into whatever large-caps are already dominating.
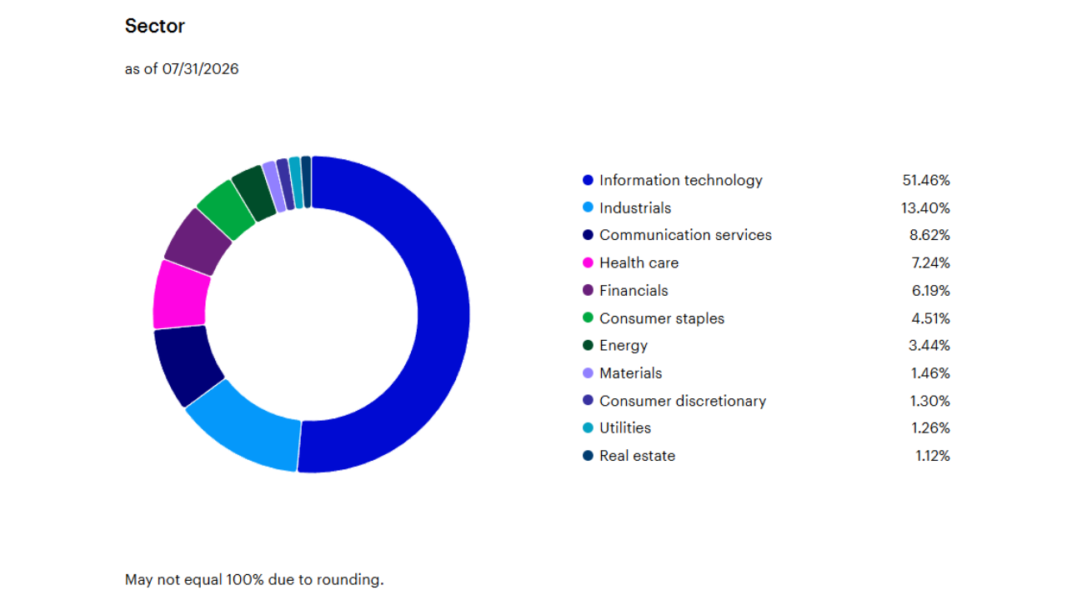
3. SPMO’s Real Returns Since Inception (November 2015 to December 2025)
Here’s the full picture since SPMO launched, measured against the S&P 500, gold, inflation (CPI), and the money supply (M2).
| Asset | CAGR (Nov 2015 to Dec 2025) |
|---|---|
| SPMO | 16.12% |
| SPY (S&P 500) | 12.37% |
| GLD (Gold) | 13.58% |
| CPI | 3.14% |
| M2 | 6.07% |
SPMO outperformed all of the benchmarks since its inception.
However, this period includes two separate investment eras which I will break down more below.
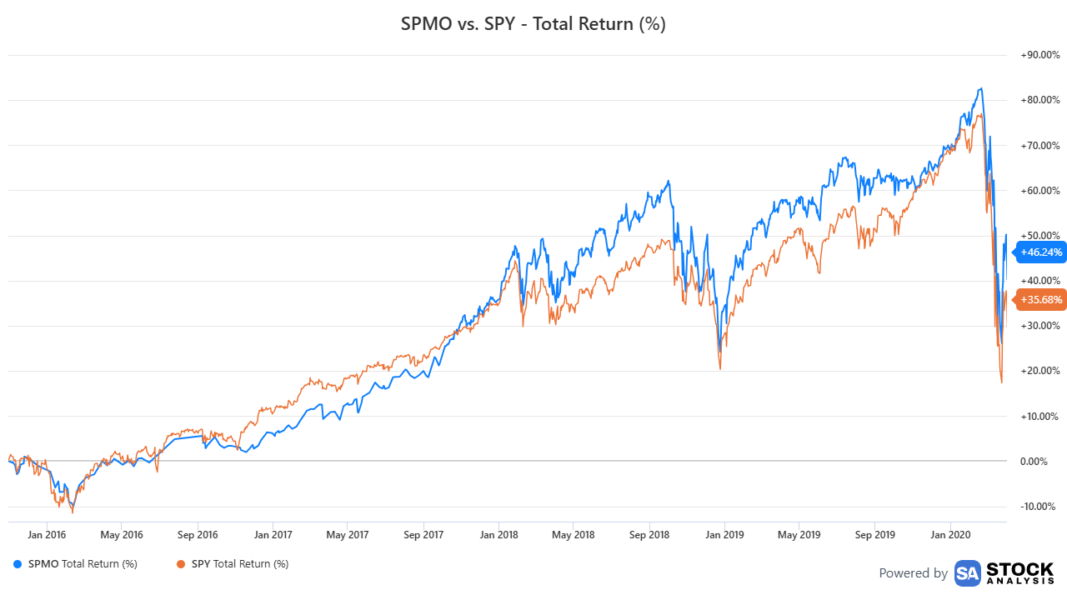
4. How SPMO Performed in the Second Era (November 2015 to March 2020)
I refer to the years between 2013 to March 2020 (before the Covid stimulus and CARES Act) as the second era of investing because this is when debt-to-GDP was hovering around 100% and interest rates were near zero.
SPMO’s inception was in November 2015, so I had to start here instead of 2013.
Here’s how SPMO performed with low interest rates and before debt-to-GDP spiked above 120%.
| Asset | CAGR (Nov 2015 to Mar 2020) |
|---|---|
| SPMO | 7.49% |
| SPY | 4.98% |
| Gold | 7.11% |
| CPI | 1.88% |
| M2 | 6.27% |
How much did SPMO outperform SPY in this era?
By 2.51% annually. This was smaller than its outperformance since inception (3.75%).
Did SPMO beat gold and M2 by much?
Barely. SPMO edged out gold by just 0.38% and M2 by 1.22%.
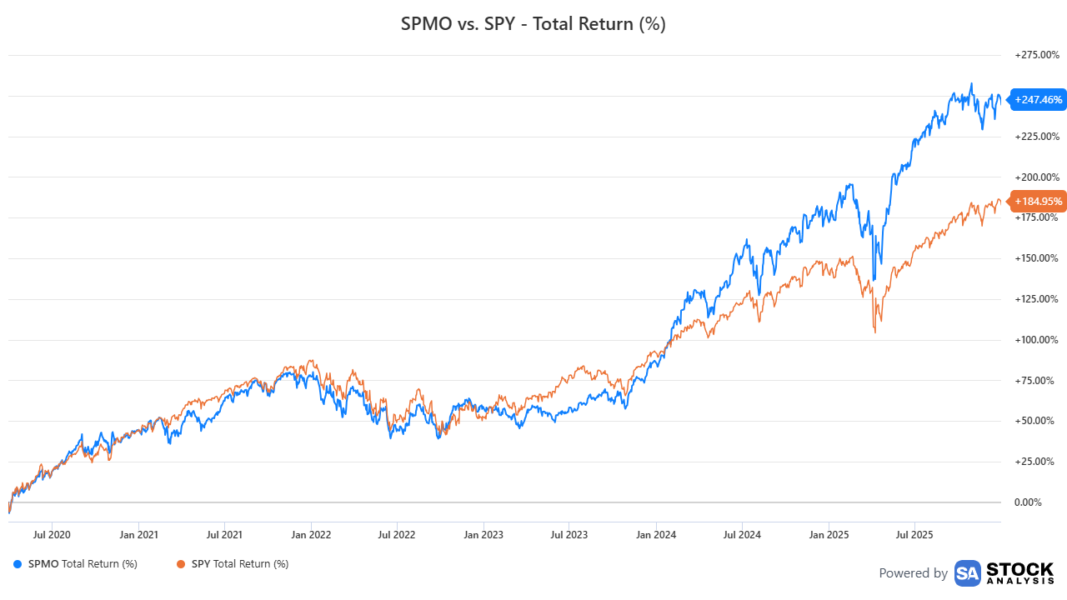
5. How SPMO Performed in the Third Era (April 2020 to December 2025)
The third era starts after COVID relief kicked in and US debt-to-GDP crossed over 120%.
[How I view investing in the third era we are currently in.]
| Asset | CAGR (Apr 2020 to Dec 2025) |
|---|---|
| SPMO | 21.25% |
| SPY | 16.24% |
| Gold | 17.50% |
| CPI | 4.36% |
| M2 | 4.98% |
How much did SPMO outperform SPY in this era?
By 5.01% annually, roughly double the gap from the first era.
Why did the gap versus M2 widen so much?
In the first era, SPMO barely beat M2 growth (1.22%). In the second era, that gap exploded to 16.27%. That spread represents real wealth SPMO created beyond simple monetary expansion.
FAQ
Is SPMO’s momentum strategy sustainable long-term?
It’s unclear. SPMO’s edge could reflect a genuine structural advantage, or it could simply be riding tech’s decade of dominance. Ten years of data is a short sample against how long markets have existed.
Is SPMO just a concentrated tech fund?
SPMO is not a tech fund. Tech has led the market for years, so SPMO’s formula has pulled it heavily into tech. If healthcare companies dominated the market, then SPMO would be heavily concentrated in healthcare.
What happens to SPMO if the market goes sideways for a long stretch?
That’s untested. SPMO only rebalances twice a year, so a prolonged sideways or choppy market could challenge how well its momentum score adapts.
How does debt-to-GDP affect SPMO’s performance?
We’ve seen SPMO dominate since debt-to-GDP crossed 120%. However, it’s unknown if SPMO will continue to outperform as the US goes further into debt.
Is SPMO better than SPY?
It has outperformed SPY in both eras studied so far. Whether that holds up in the long run is a question no one can answer.